This property has been recently remodeled and is in great shape, ready for you to move in! The floors are in excellent condition, the walls have been freshly painted. The kitchen also comes with good quality appliances, making this home both comfortable and practical.
Available for month-to-month leasing, this place is ideal for anyone looking for a fresh start.
Month to Month
Pre-foreclosure
Street View
Est. $270,300
8050 N Cedarburg Rd, Brown Deer, WI 53209
3beds
1,200sqft
Single Family Residence
Built in ----
-- sqft lot
$270,300 Zestimate®
$225/sqft
$-- HOA
Overview
- 38 days
- 19
- 3
Zillow last checked:
Listing updated:
Source: Zillow Rentals
Facts & features
Interior
Bedrooms & bathrooms
- Bedrooms: 3
- Bathrooms: 2
- Full bathrooms: 2
Rooms
- Room types: []
Appliances
- Included: Dishwasher, Refrigerator
- Laundry: None
Interior area
- Total interior livable area: 1,200 sqft
Property
Parking
- Details: Contact manager
Details
- Parcel number: 0651109000
Construction
Type & style
- Home type: SingleFamily
- Property subtype: Single Family Residence
Community & HOA
Location
- Region: Brown Deer
Financial & listing details
- Price per square foot: $225/sqft
- Tax assessed value: $246,500
- Annual tax amount: $4,451
- Date on market: 8/26/2024
- Date available: 08/26/2024
- Lease term: 1 Year
Foreclosure details
Estimated market value
$270,300
$254,000 - $287,000
$1,969/mo
Price history
| Date | Event | Price |
|---|---|---|
| 3/8/2024 | Listing removed | -- |
Source:  WIREX MLS #1852883 Report a problem | ||
| 2/12/2024 | Price change | $279,900-3.4%$233/sqft |
Source: WIREX MLS #1852883 Report a problem | ||
| 2/2/2024 | Price change | $289,900-3.3%$242/sqft |
Source: WIREX MLS #1852883 Report a problem | ||
| 11/27/2023 | Price change | $299,900-3.2%$250/sqft |
Source: WIREX MLS #1852883 Report a problem | ||
| 11/7/2023 | Price change | $309,900-1.6%$258/sqft |
Source: WIREX MLS #1852883 Report a problem | ||
| 10/12/2023 | Listed for sale | $315,000+5%$263/sqft |
Source: WIREX MLS #1852883 Report a problem | ||
| 9/28/2023 | Listing removed | -- |
Source: WIREX MLS #1829219 Report a problem | ||
| 4/26/2023 | Pending sale | $299,900$250/sqft |
Source: WIREX MLS #1829219 Report a problem | ||
| 4/16/2023 | Price change | $299,900-2.6%$250/sqft |
Source: WIREX MLS #1829219 Report a problem | ||
| 4/2/2023 | Listed for sale | $308,000+38%$257/sqft |
Source: WIREX MLS #1829219 Report a problem | ||
| 3/9/2023 | Sold | $223,200+112.6%$186/sqft |
Source: Public Record Report a problem | ||
| 8/3/2021 | Sold | $105,000+55.8%$88/sqft |
Source: Public Record Report a problem | ||
| 11/2/2012 | Sold | $67,400-3.6%$56/sqft |
Source: Public Record Report a problem | ||
| 8/31/2012 | Price change | $69,900-6.7%$58/sqft |
Source: Coldwell Banker Residential Brokerage - Mequon #1250847 Report a problem | ||
| 4/10/2012 | Listed for sale | $74,900-48.7%$62/sqft |
Source: Coldwell Banker Residential Brokerage - Mequon #1250847 Report a problem | ||
| 3/16/2007 | Sold | $146,000+70.2%$122/sqft |
Source: Public Record Report a problem | ||
| 5/11/1999 | Sold | $85,800$72/sqft |
Source: Public Record Report a problem | ||
Public tax history
| Year | Property taxes | Tax assessment |
|---|---|---|
| 2025 | $4,451 +25.2% | $246,500 +38.2% |
| 2024 | $3,556 +1.1% | $178,400 |
| 2023 | $3,516 -1% | $178,400 +11.9% |
| 2022 | $3,553 -4% | $159,400 +27.3% |
| 2021 | $3,701 | $125,200 |
| 2020 | $3,701 +1.2% | $125,200 +17.6% |
| 2019 | $3,658 +2.2% | $106,500 |
| 2018 | $3,581 +15.6% | $106,500 |
| 2017 | $3,098 -2.9% | $106,500 |
| 2016 | $3,189 -1.7% | $106,500 |
| 2015 | $3,244 -10.1% | $106,500 -10.6% |
| 2014 | $3,607 -2.1% | $119,100 |
| 2012 | $3,686 +7.7% | $119,100 -5.2% |
| 2006 | $3,421 +0.1% | $125,600 |
| 2005 | $3,419 +2.2% | $125,600 |
| 2004 | $3,346 +17.9% | $125,600 +41.6% |
| 2003 | $2,839 +3.2% | $88,700 |
| 2002 | $2,749 -3.3% | $88,700 |
| 2001 | $2,844 +2.2% | $88,700 |
| 2000 | $2,782 +3% | $88,700 |
| 1999 | $2,702 | $88,700 |
Find assessor info on the county website
Monthly payment
Climate risks
Neighborhood: 53209
- $224,5003 bd2 ba1.7k sqft8040 N Cedarburg Rd, Brown Deer, WI 53209Off Market
- $215,9002 bd2 ba1.2k sqft8062 N Cedarburg Rd, Brown Deer, WI 53209Off Market
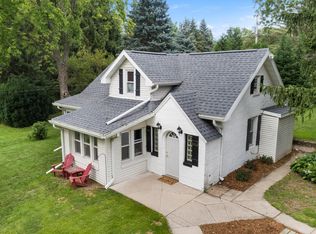
- $308,6003 bd3 ba-- sqft8032 N Cedarburg Rd, Brown Deer, WI 53209Off Market
- $216,400-- bd-- ba-- sqft8070 N Cedarburg Rd, Brown Deer, WI 53209Off Market
Similar homes
- $330,0003 bd1 ba1.7k sqft8132 N 37th STREET, Brown Deer, WI 53209Active
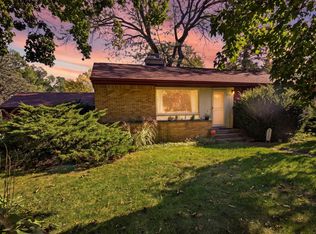 MLS ID #1986380, Joe Armentrout. WIREX MLS
- $269,9003 bd1 ba1.2k sqft5755 N Argyle AVENUE, Glendale, WI 53209Active
 MLS ID #1985719, Curt Downes. WIREX MLS
- $259,9003 bd2 ba1.5k sqft4436 W Dunwood ROAD, Brown Deer, WI 53223Active
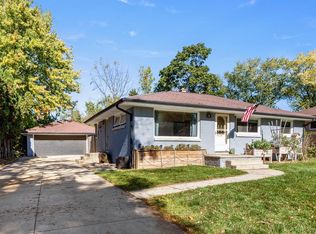 MLS ID #1985404, HIGHMARK RE Group*. WIREX MLS
- $299,9003 bd2 ba1.1k sqft8041 N 66th STREET, Brown Deer, WI 53223Active
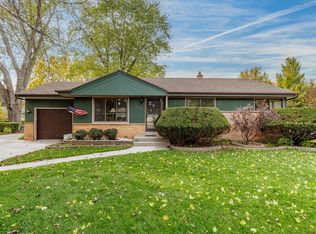 MLS ID #1986388, Thomas Squier. WIREX MLS
