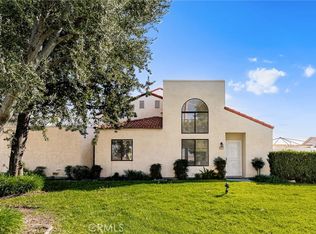
This 1231 square foot townhome home has 3 bedrooms and 3.0 bathrooms. This home is located at 8515 Salina St, Rancho Cucamonga, CA 91730.
Pre-foreclosure
Est. $518,100
8515 Salina St, Rancho Cucamonga, CA 91730
3beds
1,231sqft
Townhouse
Built in 1986
1,999 Square Feet Lot
$518,100 Zestimate®
$421/sqft
$191/mo HOA
Overview
- 114 days |
- 12 |
- 2 |
Facts & features
Interior
Bedrooms & bathrooms
- Bedrooms: 3
- Bathrooms: 3
- Full bathrooms: 2
- 1/2 bathrooms: 1
Heating
- Forced air, Gas
Cooling
- Central
Appliances
- Included: Dishwasher, Range / Oven
- Laundry: Washer Hookup, In Garage, Electric Dryer Hookup
Features
- Tile Counters, Two Story Ceilings, Cathedral Ceiling(s), Ceiling Fan(s), High Ceilings
- Flooring: Tile, Carpet
- Common walls with other units/homes: 2+ common walls
Interior area
- Total interior livable area: 1,231 sqft
Property
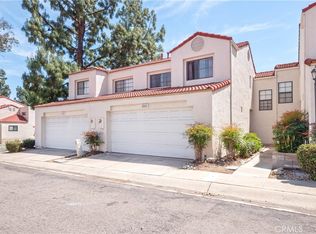
Parking
- Total spaces: 2
- Parking features: Garage - Attached
Features
- Levels: Two
- Patio & porch: Concrete
- Pool features: Association
Lot
- Size: 1,999 Square Feet
- Features: Back Yard
Details
- Parcel number: 0207622020000
- Special conditions: Standard
Construction
Type & style
- Home type: Townhouse
- Architectural style: Contemporary
Materials
- wood frame
- Roof: Tile
Condition
- Year built: 1986
Utilities & green energy
- Sewer: Public Sewer
- Water: Public
- Utilities for property: Water Connected, Sewer Connected, Electricity Connected, Natural Gas Connected
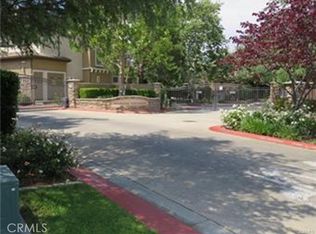
Community & HOA
HOA
- Has HOA: Yes
- Amenities included: Pool
- HOA fee: $191 monthly
Location
- Region: Rancho Cucamonga
Financial & listing details
- Price per square foot: $421/sqft
- Tax assessed value: $384,963
- Annual tax amount: $4,181
Visit our professional directory to find a foreclosure specialist in your area that can help with your home search.
Find a foreclosure agentForeclosure details
Estimated market value
$518,100
$492,000 - $544,000
$3,001/mo
Price history
| Date | Event | Price |
|---|---|---|
| 7/8/2019 | Sold | $352,000+2%$286/sqft |
Source: | ||
| 6/22/2019 | Pending sale | $345,000$280/sqft |
Source: Landmark Realtors #OC19053736 Report a problem | ||
| 5/23/2019 | Listed for sale | $345,000$280/sqft |
Source: Landmark Realtors #OC19053736 Report a problem | ||
| 5/23/2019 | Pending sale | $345,000$280/sqft |
Source: Landmark Realtors #OC19053736 Report a problem | ||
| 5/8/2019 | Listed for sale | $345,000+7.8%$280/sqft |
Source: Landmark Realtors #OC19053736 Report a problem | ||
| 3/26/2019 | Listing removed | $319,900$260/sqft |
Source: Landmark Realtors #OC19053736 Report a problem | ||
| 3/12/2019 | Listed for sale | $319,900+236.7%$260/sqft |
Source: Landmark Realtors #OC19053736 Report a problem | ||
| 4/30/1999 | Sold | $95,000$77/sqft |
Source: Public Record Report a problem | ||
Public tax history
| Year | Property taxes | Tax assessment |
|---|---|---|
| 2025 | $4,181 +2.7% | $384,963 +2% |
| 2024 | $4,071 +2.3% | $377,415 +2% |
| 2023 | $3,980 +1.8% | $370,015 +2% |
| 2022 | $3,909 +0.9% | $362,760 +2% |
| 2021 | $3,876 +1.8% | $355,647 +1% |
| 2020 | $3,807 +426.9% | $352,000 +447.2% |
| 2019 | $723 +2.4% | $64,328 +2% |
| 2018 | $705 +3.5% | $63,067 +2% |
| 2017 | $682 | $61,830 +2% |
| 2016 | $682 +1.3% | $60,618 +1.5% |
| 2015 | $673 +0.8% | $59,708 +2% |
| 2014 | $668 | $58,539 +0.5% |
| 2013 | -- | $58,275 +2% |
| 2012 | -- | $57,132 +2% |
| 2011 | -- | $56,012 +0.8% |
| 2010 | -- | $55,593 -0.2% |
| 2009 | -- | $55,725 +2% |
| 2008 | -- | $54,633 +2% |
| 2007 | -- | $53,562 +2% |
| 2006 | -- | $52,512 +2% |
| 2005 | -- | $51,482 +2% |
| 2004 | -- | $50,473 +1.9% |
| 2003 | -- | $49,548 +2% |
| 2002 | -- | $48,576 +2% |
| 2001 | -- | $47,623 +2% |
| 2000 | -- | $46,689 |
Find assessor info on the county website
Monthly payment
Estimated monthly payment$1,822
All calculations are estimates and provided by Zillow, Inc. for informational purposes only. Actual amounts may vary.
HOA fees may include property taxes on listings classified as Co-Ops. Contact the listing agent and/or owner for fee details.
Mortgage interest rates are dependent on a number of factors, including credit score, down payment, and repayment length. Interest rate data provided by Zillow Group Marketplace, Inc. as of 1/1/1970 from various mortgage lenders with which we have lead or other similar arrangements; the Estimated Payment is an average of those rates.
See how much you could borrow to make a competitive offer.
Climate risks
Neighborhood: Southwest Cucamonga
Nearby schools
GreatSchools rating
- 5/10Los Amigos Elementary SchoolGrades: K-5Distance: 0.1 mi
- 6/10Rancho Cucamonga Middle SchoolGrades: 6-8Distance: 1.9 mi
- 4/10Chaffey High SchoolGrades: 9-12Distance: 2.3 mi
Schools provided by the listing agent
- High: Chaffey
- District: Chaffey Joint Union High
Source: The MLS. This data may not be complete. We recommend contacting the local school district to confirm school assignments for this home.


Nearby cities
Nearby neighborhoods
Nearby zip codes
Other Rancho Cucamonga Topics
- Apartments for Rent in 91730
- Houses for Sale in 91730
- Houses for Rent in 91730
- 91730 Real Estate
- Rancho Cucamonga Condos
- Houses for Sale in Rancho Cucamonga
- Newest Listings in Rancho Cucamonga
- Rancho Cucamonga Home Values
- Rancho Cucamonga Real Estate Agents
- Rancho Cucamonga Refinance
- Rancho Cucamonga Mortgage Rates
