Welcome to this charming home featuring a covered front porch and a yard shaded by mature trees. Inside, the home offers a bright and inviting atmosphere with neutral finishes and laminate flooring throughout the main living areas. The kitchen features stainless steel appliances and ample storage, while natural light fills the living spaces and bedrooms. Ceiling fans add a nice touch to the bedrooms. This home is a great opportunity to add your personal touch and make it your own!
For sale
$250,000
8618 20TH STREET, TAMPA, FL 33619
3beds
968sqft
Single Family Residence
Built in 1961
5,000 Square Feet Lot
$242,900 Zestimate®
$258/sqft
$-- HOA
What's special
Neutral finishesCovered front porchAmple storageBright and inviting atmosphere
- 8 days
- 287
- 25
Likely to sell faster than
Zillow last checked:
Listing updated:
Listed by:
William Figueroa 305-662-1502,
SOVEREIGN REAL ESTATE GROUP 305-662-1502
Source: Stellar MLS,MLS#: C7531824 Originating MLS: Port Charlotte
Facts & features
Interior
Bedrooms & bathrooms
- Bedrooms: 3
- Bathrooms: 2
- Full bathrooms: 2
Rooms
- Room types: Great Room
Primary bedroom
- Features: Coat Closet
- Level: First
Kitchen
- Features: Breakfast Bar, Pantry
- Level: First
Living room
- Level: First
Heating
- Central, Electric
Cooling
- Central Air
Appliances
- Included: Microwave, Range, Refrigerator
- Laundry: Inside
Features
- Other
- Flooring: Laminate
- Has fireplace: No
Interior area
- Total structure area: 1,064
- Total interior livable area: 968 sqft
Video & virtual tour
Property
Parking
- Parking features: None
Features
- Levels: One
- Stories: 1
- Patio & porch: Deck
- Exterior features: None
Lot
- Size: 5,000 Square Feet
- Dimensions: 50 x 100
- Features: Near Public Transit
- Residential vegetation: Trees/Landscaped
Details
- Parcel number: A192819458B0000000001.1
- Zoning: RS-50
- Special conditions: None
Construction
Type & style
- Home type: SingleFamily
- Architectural style: Traditional
- Property subtype: Single Family Residence
Materials
- Wood Frame
- Foundation: Slab
- Roof: Shingle
Condition
- New construction: No
- Year built: 1961
Utilities & green energy
- Sewer: Public Sewer
- Water: Public
- Utilities for property: Cable Available, Fire Hydrant, Public, Street Lights
Community & HOA
Community
- Pet fee: $0 monthly
- Subdivision: HILLSBORO HEIGHTS MAP SOUTH
HOA
- Has HOA: No
Location
- Region: Tampa
Financial & listing details
- Price per square foot: $258/sqft
- Tax assessed value: $164,536
- Annual tax amount: $3,123
- Date on market: 10/12/2026
- Cumulative days on market: 9 days
- Listing terms: Cash,Conventional,FHA,VA Loan
- Ownership: Fee Simple
- Total actual rent: 0
- Road surface type: Paved, Asphalt
Estimated market value
$242,900
$231,000 - $255,000
$1,846/mo
Price history
| Date | Event | Price |
|---|---|---|
| 10/12/2026 | Listed for sale | $250,000+78.7%$258/sqft |
Source:  Stellar MLS #C7531824 Report a problem | ||
| 9/10/2026 | Listing removed | $1,745$2/sqft |
Source: Zillow Rentals Report a problem | ||
| 8/13/2026 | Price change | $1,745-2.8%$2/sqft |
Source: Zillow Rentals Report a problem | ||
| 7/29/2026 | Price change | $1,795-2.7%$2/sqft |
Source: Zillow Rentals Report a problem | ||
| 7/15/2026 | Price change | $1,845-2.8%$2/sqft |
Source: Zillow Rentals Report a problem | ||
| 7/2/2026 | Price change | $1,899-3.8%$2/sqft |
Source: Zillow Rentals Report a problem | ||
| 6/8/2026 | Listed for rent | $1,975+10%$2/sqft |
Source: Zillow Rentals Report a problem | ||
| 3/25/2024 | Listing removed | -- |
Source: Zillow Rentals Report a problem | ||
| 2/20/2024 | Listed for rent | $1,795+35.5%$2/sqft |
Source: Zillow Rentals Report a problem | ||
| 3/23/2021 | Listing removed | -- |
Source: Zillow Rental Network Premium Report a problem | ||
| 3/18/2021 | Price change | $1,325-1.9%$1/sqft |
Source: Zillow Rental Network Premium Report a problem | ||
| 2/26/2021 | Price change | $1,350-1.8%$1/sqft |
Source: Zillow Rental Network Premium Report a problem | ||
| 2/10/2021 | Price change | $1,375-1.4%$1/sqft |
Source: Zillow Rental Network Premium Report a problem | ||
| 1/26/2021 | Price change | $1,395-1.4%$1/sqft |
Source: Zillow Rental Network Premium Report a problem | ||
| 12/29/2020 | Price change | $1,415-1.4%$1/sqft |
Source: Sylvan Homes Report a problem | ||
| 12/23/2020 | Price change | $1,435-1.7%$1/sqft |
Source: Zillow Rental Network Premium Report a problem | ||
| 11/10/2020 | Listed for rent | $1,460+6.2%$2/sqft |
Source: Sylvan Homes Report a problem | ||
| 6/19/2020 | Listing removed | $1,375$1/sqft |
Source: Sylvan Homes Report a problem | ||
| 6/5/2020 | Price change | $1,375-1.4%$1/sqft |
Source: Sylvan Homes Report a problem | ||
| 5/21/2020 | Price change | $1,395-2.9%$1/sqft |
Source: Sylvan Homes Report a problem | ||
| 4/14/2020 | Price change | $1,437+6.4%$1/sqft |
Source: Sylvan Homes Report a problem | ||
| 3/26/2020 | Listed for rent | $1,350$1/sqft |
Source: Sylvan Homes Report a problem | ||
| 9/13/2019 | Listing removed | $1,350$1/sqft |
Source: Sylvan Homes Report a problem | ||
| 8/16/2019 | Listed for rent | $1,350$1/sqft |
Source: Sylvan Homes Report a problem | ||
| 6/5/2019 | Listing removed | $139,900+137.1%$145/sqft |
Source: MIHARA & ASSOCIATES INC. #T3176738 Report a problem | ||
| 2/4/2003 | Sold | $59,000+47.5%$61/sqft |
Source: Public Record Report a problem | ||
| 11/16/1999 | Sold | $40,000-18.2%$41/sqft |
Source: Public Record Report a problem | ||
| 10/8/1997 | Sold | $48,900$51/sqft |
Source: Public Record Report a problem | ||
Public tax history
| Year | Property taxes | Tax assessment |
|---|---|---|
| 2025 | $3,123 +11.3% | $146,301 +10% |
| 2024 | $2,807 +5.6% | $133,001 +10% |
| 2023 | $2,657 +6.9% | $120,910 +10% |
| 2022 | $2,485 +17.4% | $109,918 +10% |
| 2021 | $2,118 +11.2% | $99,925 +10% |
| 2020 | $1,904 +73.8% | $90,841 +106.4% |
| 2019 | $1,095 | $44,015 -25.6% |
| 2018 | $1,095 +7% | $59,148 +28.7% |
| 2017 | $1,024 +14.7% | $45,973 +39% |
| 2016 | $893 +17% | $33,069 +10% |
| 2015 | $763 +14.7% | $30,063 -1.7% |
| 2014 | $666 | $30,577 +10% |
| 2013 | $666 +14.2% | $27,797 +6.8% |
| 2012 | $583 -7.5% | $26,026 -7.6% |
| 2011 | $630 -18.5% | $28,176 -19.5% |
| 2010 | $773 -44.6% | $35,005 -45% |
| 2009 | $1,394 -30.4% | $63,591 -30.5% |
| 2008 | $2,004 -3.9% | $91,445 -5% |
| 2007 | $2,085 -0.6% | $96,302 +8.8% |
| 2006 | $2,097 +35.6% | $88,516 +40.2% |
| 2005 | $1,546 | $63,126 +7.5% |
| 2004 | -- | $58,695 +13.3% |
| 2003 | -- | $51,811 +1.4% |
| 2002 | -- | $51,075 +10.6% |
| 2001 | -- | $46,198 +15% |
| 2000 | $1,024 | $40,173 |
Find assessor info on the county website
Monthly payment
Est. payment
Payment breakdown
Explore the cost of this home by adjusting the details. Changes won't be saved.Climate risks
Neighborhood: Sulphur Springs


Similar homes
- $245,0003 bd2 ba1.2k sqft9309 N 21ST STREET, TAMPA, FL 33612For Sale
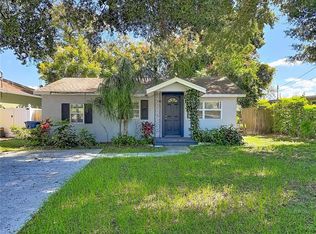
 MLS ID #TB8556997, Sapir Simply, ARC REALTY GROUP. Stellar MLS
- $234,9003 bd2 ba1.1k sqft8307 N ELMER STREET, TAMPA, FL 33604For Sale
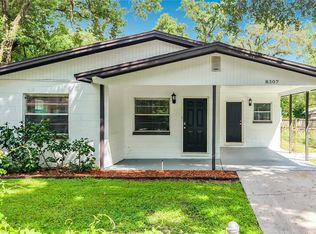 MLS ID #TB8548667, Don Suda, TAMPA BAY PREMIER REALTY. Stellar MLS
- $219,0003 bd2 ba1k sqft8410 N SEMMES STREET, TAMPA, FL 33604For Sale
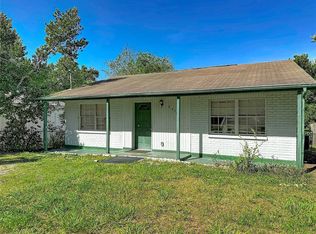 MLS ID #TB8540931, Sapir Simply, ARC REALTY GROUP. Stellar MLS
- $265,0003 bd1 ba1.2k sqft8311 N 18TH STREET, TAMPA, FL 33604For Sale
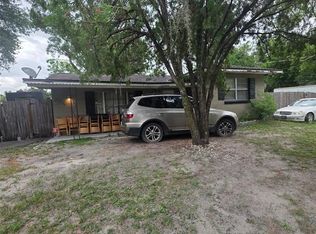 MLS ID #O6421688, Tina Ramotar, RAZZANI INTERNATIONAL REALTY. Stellar MLS
- $269,0003 bd2 ba1k sqft8205 N SEMMES STREET, TAMPA, FL 33604For SaleMLS ID #TB8427255, Correy Smith, KELLER WILLIAMS SOUTH TAMPA. Stellar MLS
- $245,0002 bd1 ba624 sqft8713 N 39TH STREET, TAMPA, FL 33604For SaleMLS ID #TB8557335, Angelica Quinones, CHIRINO REAL ESTATE. Stellar MLS
- $265,0003 bd2 ba1.3k sqft8605 N 12TH STREET, TAMPA, FL 33604For SaleMLS ID #TB8533465, Maressa Saint Germain, IMPACT REALTY TAMPA BAY. Stellar MLS
- $260,0004 bd2 ba1.3k sqft1516 E WATERS AVENUE, TAMPA, FL 33604For SaleMLS ID #TB8471248, Maria Hourdas, KELLER WILLIAMS REALTY- PALM HARBOR. Stellar MLS
- $299,9993 bd2 ba1k sqft8416 N 17TH STREET, TAMPA, FL 33604For SaleMLS ID #L4964901, Sanna Taha, ELEVE REAL ESTATE LLC. Stellar MLS
- $275,0003 bd1 ba840 sqft10012 N 14TH STREET, TAMPA, FL 33612For SaleMLS ID #TB8559131, Beth Cupari, COASTAL PROPERTIES GROUP INTER. Stellar MLS
- $289,9003 bd1 ba1.1k sqft1510 E WATERS AVENUE, TAMPA, FL 33604For SaleMLS ID #TB8548037, Mary Stinyard, CHARLES RUTENBERG REALTY INC. Stellar MLS
- $265,0002 bd2 ba849 sqft8705 N 13TH STREET, TAMPA, FL 33604For SaleMLS ID #TB8550628, Chase Reilly, COMPASS FLORIDA LLC. Stellar MLS
- $245,0004 bd2 ba1k sqft8010 N 13TH STREET, TAMPA, FL 33604For SaleMLS ID #TB8528939, Sapir Simply, ARC REALTY GROUP. Stellar MLS
- $299,9003 bd2 ba1k sqft2110 E NEDRO ROAD, TAMPA, FL 33604For SaleMLS ID #TB8526171, Valeria Aliaga, NETWORTH REALTY OF TAMPA, LLC. Stellar MLS
- $269,0004 bd2 ba1.1k sqft8117 N KLONDYKE STREET, TAMPA, FL 33604For SaleMLS ID #TB8543556, Tina White, EXP REALTY LLC. Stellar MLS
- $230,0002 bd1 ba852 sqft910 E ESKIMO AVENUE, TAMPA, FL 33604For SaleMLS ID #TB8554667, Aprilyn Cloyd, REALTY ONE GROUP INNOVATION. Stellar MLS
- $305,0002 bd1 ba1.2k sqft8216 N 14TH STREET, TAMPA, FL 33604For SaleMLS ID #TB8476592, Magda Perez, INTEGRITY REAL PROPERTIES,IN. Stellar MLS
- $239,9003 bd2 ba924 sqft8014 N ALASKA STREET, TAMPA, FL 33604For SaleMLS ID #TB8345799, Rima Jbour, CENTURY 21 ROSA LEON. Stellar MLS
- $296,9003 bd2 ba1.1k sqft1705 E BIRD STREET, TAMPA, FL 33604For SaleMLS ID #TB8536180, Lynne Powers, POWERS REAL ESTATE SOLUTIONS LLC. Stellar MLS
