Location location location! 0.3 miles from Oak Grove Station and minutes to Routes 1 and 93, commuting to Boston is a breeze. Enter the 1st floor is the living room, kitchen and two more rooms. Three more bedrooms with 1 full renovated bath on the 2nd floor, Plenty of storage space in basement. 1 car garage completes the package. Open house Sat and Sun 11 to 3pm! Don't miss this opportunity! Easy to show!
For sale
$750,000
89 Dutton St, Malden, MA 02148
5beds
1,744sqft
Single Family Residence
Built in 1935
4,587 Square Feet Lot
$753,000 Zestimate®
$430/sqft
$-- HOA
What's special
Full renovated bath
- 35 days
- 1,773
- 103
Likely to sell faster than
Zillow last checked:
Listing updated:
Listed by:
Alex Wang 617-301-0076,
Hestia 617-301-0076,
team_hestia 617-301-0076
Source: MLS PIN,MLS#: 73591554
Facts & features
Interior
Bedrooms & bathrooms
- Bedrooms: 5
- Bathrooms: 3
- Full bathrooms: 3
Heating
- Natural Gas
Cooling
- None
Features
- Basement: Full
- Number of fireplaces: 1
Interior area
- Total structure area: 1,744
- Total interior livable area: 1,744 sqft
- Finished area above ground: 1,744
Property
Parking
- Total spaces: 2
- Parking features: Attached, Off Street
- Attached garage spaces: 1
- Uncovered spaces: 1
Lot
- Size: 4,587 Square Feet
- Features: Corner Lot
Details
- Parcel number: M:0008 B:0059 L:0914,591162
- Zoning: ResA
Construction
Type & style
- Home type: SingleFamily
- Architectural style: Colonial
- Property subtype: Single Family Residence
Materials
- Foundation: Concrete Perimeter
Condition
- Year built: 1935
Utilities & green energy
- Sewer: Public Sewer
- Water: Public
Community & HOA
Community
- Features: Public Transportation
HOA
- Has HOA: No
Location
- Region: Malden
Financial & listing details
- Price per square foot: $430/sqft
- Tax assessed value: $694,500
- Annual tax amount: $7,917
- Date on market: 10/15/2026
Estimated market value
$753,000
$715,000 - $791,000
$3,569/mo
Price history
| Date | Event | Price |
|---|---|---|
| 10/15/2026 | Listed for sale | $750,000+67.4%$430/sqft |
Source: MLS PIN #73591554 Report a problem | ||
| 9/1/2017 | Sold | $448,000$257/sqft |
Source: Public Record Report a problem | ||
| 6/24/2017 | Pending sale | $448,000$257/sqft |
Source: Cindy Cai Realty LLC #72173778 Report a problem | ||
| 6/1/2017 | Listed for sale | $448,000+108.4%$257/sqft |
Source: Cindy Cai Realty LLC #72173778 Report a problem | ||
| 5/24/2012 | Sold | $215,000+10.3%$123/sqft |
Source: Public Record Report a problem | ||
| 2/29/2012 | Price change | $194,900-42.7%$112/sqft |
Source: Homepath #71343555 Report a problem | ||
| 2/26/2012 | Listed for sale | -- |
Source: Homepath #71343555 Report a problem | ||
| 9/8/2005 | Sold | $340,000+96.5%$195/sqft |
Source: Public Record Report a problem | ||
| 10/30/1998 | Sold | $173,000$99/sqft |
Source: Public Record Report a problem | ||
Public tax history
| Year | Property taxes | Tax assessment |
|---|---|---|
| 2025 | $7,364 +6.3% | $650,500 +9.8% |
| 2024 | $6,926 +1.5% | $592,500 +5.8% |
| 2023 | $6,826 +4.5% | $560,000 +5.9% |
| 2022 | $6,529 +6% | $528,700 +5.4% |
| 2021 | $6,162 +3% | $501,400 +6% |
| 2020 | $5,982 +7.9% | $472,900 +13.2% |
| 2019 | $5,542 +3.6% | $417,600 +10% |
| 2018 | $5,347 +2.4% | $379,500 +2.9% |
| 2017 | $5,224 +1.1% | $368,700 +8.2% |
| 2016 | $5,168 +2.6% | $340,900 +6.5% |
| 2015 | $5,035 +3.8% | $320,100 +6.2% |
| 2014 | $4,851 +4.1% | $301,300 +2.6% |
| 2013 | $4,662 +10.8% | $293,600 |
| 2012 | $4,207 +5.5% | $293,600 |
| 2011 | $3,987 +4.9% | $293,600 -4.2% |
| 2010 | $3,799 +14.4% | $306,600 -8.5% |
| 2009 | $3,321 +6.7% | $335,100 -2.7% |
| 2008 | $3,113 +7% | $344,400 -2.3% |
| 2007 | $2,909 -8.6% | $352,600 -9.1% |
| 2006 | $3,183 +17.4% | $387,700 +24.2% |
| 2005 | $2,712 +4.3% | $312,100 +6.9% |
| 2004 | $2,601 +3.9% | $291,900 +63.9% |
| 2003 | $2,504 +3.9% | $178,100 |
| 2002 | $2,411 +6.6% | $178,100 +37.3% |
| 2000 | $2,261 +3.5% | $129,700 |
| 1999 | $2,185 | $129,700 |
Find assessor info on the county website
Monthly payment
Est. payment
Payment breakdown
Explore the cost of this home by adjusting the details. Changes won't be saved.Climate risks
Neighborhood: West End
Similar homes
- $749,8884 bd3 ba1.7k sqft19-21 Gale St, Malden, MA 02148For Sale
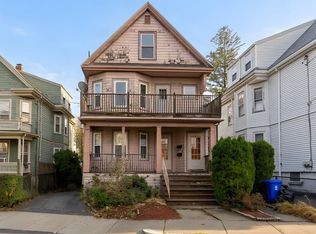 MLS ID #73602759, Amy Solomons, True North Realty. MLS PIN
- $--3 bd2 ba1.5k sqft50 Pagum St, Malden, MA 02148Auction
 Auction.com 2
- $679,0003 bd2 ba1.3k sqft70 Pine St, Malden, MA 02148For Sale
 MLS ID #73602577, Team Ladner, RE/MAX Harmony. MLS PIN
- $749,0003 bd3 ba1.2k sqft11 Nevada Ave, Malden, MA 02148For Sale
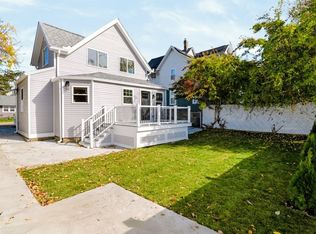 MLS ID #73596431, Farzad Abdi, Venture. MLS PIN
