$318,400
5 bd|4 ba|3k sqft
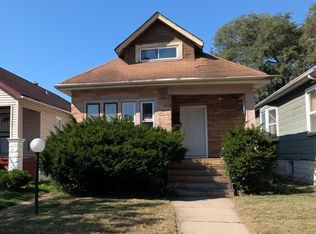
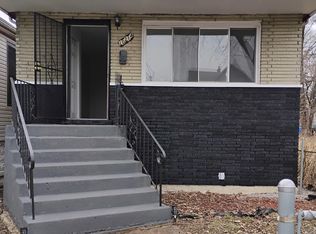
10201 S Wallace St, Chicago, IL 60628
Off Market

Zillow last checked:
Listing updated:
T'Keyah Williams 847-495-5000,
HomeSmart Connect LLC
$150,400
$143,000 - $158,000
$2,305/mo
| Date | Event | Price |
|---|---|---|
| 6/11/2026 | Listed for sale | $149,000-43.5%$68/sqft |
Source: | ||
| 9/28/2023 | Listing removed | -- |
Source: | ||
| 9/25/2023 | Price change | $263,900-2.2%$120/sqft |
Source: | ||
| 8/2/2023 | Listed for sale | $269,900-3.6%$123/sqft |
Source: | ||
| 7/21/2023 | Listing removed | -- |
Source: | ||
| 7/2/2023 | Listed for sale | $279,900+1.8%$127/sqft |
Source: | ||
| 6/5/2023 | Listing removed | -- |
Source: | ||
| 5/31/2023 | Price change | $274,900-1.8%$125/sqft |
Source: | ||
| 5/29/2023 | Listed for sale | $279,900$127/sqft |
Source: | ||
| 5/8/2023 | Contingent | $279,900$127/sqft |
Source: | ||
| 4/27/2023 | Listed for sale | $279,900-1.8%$127/sqft |
Source: | ||
| 4/13/2023 | Listing removed | -- |
Source: | ||
| 1/20/2023 | Price change | $284,900-1.7%$130/sqft |
Source: | ||
| 12/28/2022 | Listed for sale | $289,900-3.3%$132/sqft |
Source: | ||
| 12/3/2022 | Listing removed | -- |
Source: | ||
| 11/12/2022 | Price change | $299,900-3.2%$136/sqft |
Source: | ||
| 10/27/2022 | Price change | $309,900-3.1%$141/sqft |
Source: | ||
| 10/17/2022 | Price change | $319,900-3%$145/sqft |
Source: | ||
| 10/1/2022 | Listed for sale | $329,900+258.6%$150/sqft |
Source: | ||
| 7/27/2021 | Sold | $92,000-3.2%$42/sqft |
Source: | ||
| 7/16/2021 | Contingent | $95,000$43/sqft |
Source: | ||
| 6/29/2021 | Listed for sale | $95,000+30.1%$43/sqft |
Source: | ||
| 5/2/2003 | Sold | $73,000+23.7%$33/sqft |
Source: Public Record Report a problem | ||
| 7/27/2001 | Sold | $59,000$27/sqft |
Source: Public Record Report a problem | ||
| Year | Property taxes | Tax assessment |
|---|---|---|
| 2024 | -- | $8,700 +52.7% |
| 2023 | $1,205 +2.5% | $5,699 |
| 2022 | $1,176 +2.3% | $5,699 |
| 2021 | $1,149 -45.4% | $5,699 -39.5% |
| 2020 | $2,105 +0.9% | $9,424 -9% |
| 2019 | $2,086 +1.7% | $10,356 |
| 2018 | $2,051 -12.2% | $10,356 -4.3% |
| 2017 | $2,335 +7.5% | $10,825 |
| 2016 | $2,173 +9.3% | $10,825 |
| 2015 | $1,989 +4.4% | $10,825 +5.7% |
| 2014 | $1,905 +2% | $10,243 |
| 2013 | $1,867 +1.4% | $10,243 |
| 2012 | $1,842 +5.4% | $10,243 -4.8% |
| 2011 | $1,748 -0.4% | $10,763 |
| 2010 | $1,755 +4.4% | $10,763 |
| 2009 | $1,682 -13.8% | $10,763 -20.7% |
| 2008 | $1,951 +1.1% | $13,576 |
| 2007 | $1,930 -1.1% | $13,576 |
| 2006 | $1,951 +33.5% | $13,576 +52% |
| 2005 | $1,461 +1% | $8,929 |
| 2004 | $1,447 +2.2% | $8,929 |
| 2003 | $1,416 +8.1% | $8,929 +22.6% |
| 2002 | $1,310 +3.7% | $7,281 |
| 2001 | $1,263 +12.3% | $7,281 |
| 2000 | $1,125 -0.7% | $7,281 +24.6% |
| 1999 | $1,132 | $5,845 |
Source: MRED as distributed by MLS GRID. This data may not be complete. We recommend contacting the local school district to confirm school assignments for this home.
A local agent can set up tours, give advice and negotiate with sellers.