$562,600
3 bd|3 ba|2.2k sqft
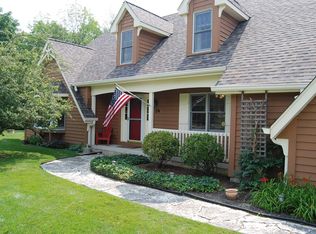
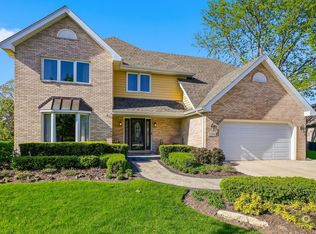
18 Emily Ct, Lemont, IL 60439
Off Market
Zillow last checked:
Listing updated:
Wendy Pawlak, CSC (630)514-6615,
Keller Williams Experience
Not available
Estimated sales range
Not available
Not available
| Date | Event | Price |
|---|---|---|
| 6/25/2026 | Price change | $800,000-5.9%$199/sqft |
Source: | ||
| 6/17/2026 | Listed for sale | $850,000+91%$211/sqft |
Source: | ||
| 6/11/2018 | Sold | $445,000-1.1%$111/sqft |
Source: | ||
| 4/26/2018 | Pending sale | $449,900$112/sqft |
Source: Realtopia Real Estate Inc #09918559 Report a problem | ||
| 4/19/2018 | Listed for sale | $449,900-5.3%$112/sqft |
Source: Realtopia Real Estate Inc #09918559 Report a problem | ||
| 8/19/2015 | Listing removed | $474,900$118/sqft |
Source: Coldwell Banker Honig-Bell #09004563 Report a problem | ||
| 8/8/2015 | Listed for sale | $474,900$118/sqft |
Source: Coldwell Banker Honig-Bell #09004563 Report a problem | ||
| 7/6/2015 | Listing removed | $474,900$118/sqft |
Source: Illinois Premier Homes #08796067 Report a problem | ||
| 6/22/2015 | Price change | $474,900-4%$118/sqft |
Source: Illinois Premier Homes #08796067 Report a problem | ||
| 4/19/2015 | Price change | $494,900-1%$123/sqft |
Source: Illinois Premier Homes #08796067 Report a problem | ||
| 12/4/2014 | Listed for sale | $499,900$124/sqft |
Source: Prospect Equities #08796067 Report a problem | ||
| Year | Property taxes | Tax assessment |
|---|---|---|
| 2024 | -- | $55,343 +0% |
| 2023 | $10,812 +33.1% | $55,341 +50% |
| 2022 | $8,124 +2.9% | $36,884 |
| 2021 | $7,897 -11.4% | $36,884 -9.1% |
| 2020 | $8,909 +1.4% | $40,562 +6.8% |
| 2019 | $8,786 +11.8% | $37,986 |
| 2018 | $7,860 +1.3% | $37,986 |
| 2017 | $7,756 +0.1% | $37,986 +7.6% |
| 2016 | $7,747 -1.1% | $35,313 |
| 2015 | $7,834 -1.1% | $35,313 |
| 2014 | $7,922 +11.3% | $35,313 +4% |
| 2013 | $7,117 +2.7% | $33,940 |
| 2012 | $6,931 +3.2% | $33,940 |
| 2011 | $6,718 -15% | $33,940 -26.2% |
| 2010 | $7,901 +7.7% | $45,991 |
| 2009 | $7,337 +15.8% | $45,991 -5% |
| 2008 | $6,338 -10.9% | $48,412 +0.9% |
| 2007 | $7,114 +4.7% | $47,974 |
| 2006 | $6,793 +1.1% | $47,974 |
| 2005 | $6,722 +25% | $47,974 +49.7% |
| 2004 | $5,379 -5.3% | $32,057 |
| 2003 | $5,682 | $32,057 |
Source: MRED as distributed by MLS GRID. This data may not be complete. We recommend contacting the local school district to confirm school assignments for this home.
A local agent can set up tours, give advice and negotiate with sellers.