$183,500
-- bd|-- ba|1.1k sqft
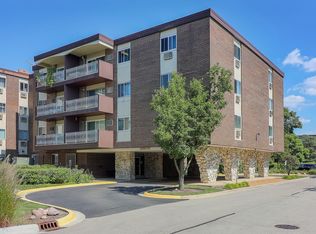
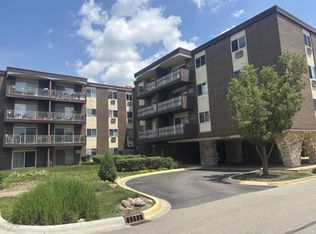
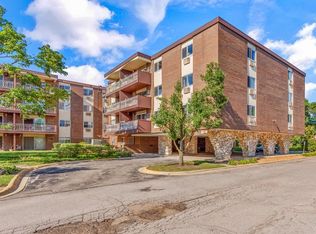
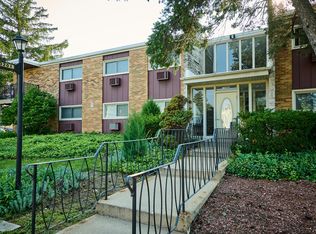
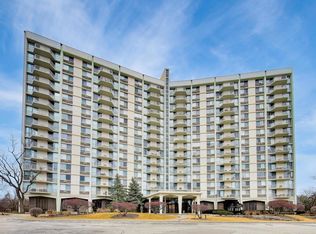
1311 S Finley Rd APT 101, Lombard, IL 60148
Off Market
Zillow last checked:
Debra Yuhas, SRES 630-913-0524,
RE/MAX All Pro - St Charles
$190,300
$181,000 - $200,000
$1,914/mo
| Date | Event | Price |
|---|---|---|
| 5/29/2026 | Listing removed | $199,900$172/sqft |
Source: MRED as distributed by MLS GRID #12650989 Report a problem | ||
| 5/18/2026 | Listed for sale | $199,900-2%$172/sqft |
Source: MRED as distributed by MLS GRID #12650989 Report a problem | ||
| 5/18/2026 | Listing removed | $203,900$175/sqft |
Source: | ||
| 5/4/2026 | Listed for sale | $203,900+0.2%$175/sqft |
Source: | ||
| 5/4/2026 | Listing removed | $203,500$175/sqft |
Source: | ||
| 4/7/2026 | Contingent | $203,500$175/sqft |
Source: | ||
| 3/28/2026 | Price change | $203,500-1.7%$175/sqft |
Source: | ||
| 3/20/2026 | Listed for sale | $207,000+80.2%$178/sqft |
Source: | ||
| 8/20/2019 | Sold | $114,900$99/sqft |
Source: | ||
| 7/23/2019 | Pending sale | $114,900$99/sqft |
Source: Keller Williams Realty Premiere Properties #10468562 Report a problem | ||
| 7/17/2019 | Listed for sale | $114,900+22.2%$99/sqft |
Source: Keller Williams Premiere Properties #10454533 Report a problem | ||
| 10/4/2002 | Sold | $94,000$81/sqft |
Source: Public Record Report a problem | ||
| Year | Property taxes | Tax assessment |
|---|---|---|
| 2024 | $2,527 +8.8% | $48,523 +8.1% |
| 2023 | $2,322 -20.3% | $44,870 +5.6% |
| 2022 | $2,913 +3.5% | $42,500 +2.6% |
| 2021 | $2,814 +2.4% | $41,440 +2.2% |
| 2020 | $2,748 +5.9% | $40,530 +5.2% |
| 2019 | $2,595 +165.4% | $38,530 +25.2% |
| 2018 | $978 -23% | $30,770 +18.6% |
| 2017 | $1,270 +22.4% | $25,950 +6.1% |
| 2016 | $1,038 -1.9% | $24,450 +7.3% |
| 2015 | $1,058 -7% | $22,780 -2.2% |
| 2014 | $1,138 -28% | $23,300 -1.4% |
| 2013 | $1,581 -0.1% | $23,620 -6.2% |
| 2012 | $1,582 -28.2% | $25,170 -30% |
| 2011 | $2,204 -4% | $35,960 -10.8% |
| 2010 | $2,295 +2% | $40,300 -6.8% |
| 2009 | $2,249 +1.8% | $43,230 |
| 2008 | $2,209 +5.7% | $43,230 +8.8% |
| 2007 | $2,089 +3.2% | $39,730 +3.8% |
| 2006 | $2,024 +6.6% | $38,280 +6.9% |
| 2005 | $1,898 +7.4% | $35,810 +6.3% |
| 2004 | $1,767 -9.7% | $33,690 -2.3% |
| 2003 | $1,957 +7.4% | $34,500 +12.7% |
| 2002 | $1,822 +2.6% | $30,610 +8.8% |
| 2001 | $1,776 +2.9% | $28,140 +5.2% |
| 2000 | $1,727 | $26,750 |
Source: MRED as distributed by MLS GRID. This data may not be complete. We recommend contacting the local school district to confirm school assignments for this home.
A local agent can set up tours, give advice and negotiate with sellers.
A local lender can help you make sure your offer is ready when you are.