$388,800
3 bd|1 ba|1.2k sqft
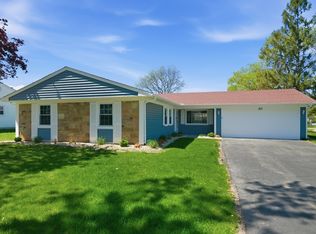
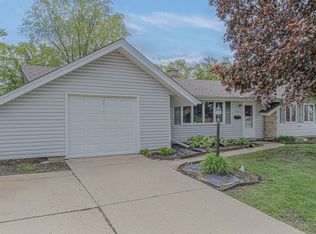
6 Standish Ln, Schaumburg, IL 60193
Off Market
Likely to sell faster than
Zillow last checked:
Mudassir Siddiqui 630-965-5492,
HomeSmart Connect LLC
Not available
Estimated sales range
Not available
Not available
| Date | Event | Price |
|---|---|---|
| 1/29/2025 | Listing removed | $443,500$195/sqft |
Source: | ||
| 12/19/2024 | Price change | $443,500-0.1%$195/sqft |
Source: | ||
| 12/10/2024 | Price change | $444,000-0.1%$196/sqft |
Source: | ||
| 11/24/2024 | Price change | $444,500-0.1%$196/sqft |
Source: | ||
| 11/13/2024 | Price change | $445,000-0.9%$196/sqft |
Source: | ||
| 11/5/2024 | Price change | $449,000-5.5%$198/sqft |
Source: | ||
| 10/30/2024 | Listed for sale | $475,000$209/sqft |
Source: | ||
| 10/21/2024 | Listing removed | $475,000-4.8%$209/sqft |
Source: | ||
| 10/5/2024 | Listed for sale | $499,000+33.1%$220/sqft |
Source: | ||
| 9/29/2023 | Listing removed | -- |
Source: Zillow Rentals Report a problem | ||
| 9/19/2023 | Listed for rent | $3,300-5.7%$1/sqft |
Source: Zillow Rentals Report a problem | ||
| 9/6/2023 | Listing removed | -- |
Source: Zillow Rentals Report a problem | ||
| 8/16/2023 | Price change | $3,500-7.9%$2/sqft |
Source: Zillow Rentals Report a problem | ||
| 7/4/2023 | Price change | $3,800+8.6%$2/sqft |
Source: Zillow Rentals Report a problem | ||
| 11/17/2022 | Listed for rent | $3,500$2/sqft |
Source: Zillow Rental Manager Report a problem | ||
| 11/10/2022 | Sold | $375,000-6.2%$165/sqft |
Source: | ||
| 10/5/2022 | Contingent | $399,999$176/sqft |
Source: | ||
| 9/29/2022 | Price change | $399,999-3.6%$176/sqft |
Source: | ||
| 9/8/2022 | Price change | $415,000-3.5%$183/sqft |
Source: | ||
| 8/3/2022 | Listed for sale | $429,900+16.2%$189/sqft |
Source: | ||
| 8/3/2022 | Listing removed | -- |
Source: | ||
| 6/17/2022 | Listed for sale | $369,900-1.3%$163/sqft |
Source: | ||
| 6/13/2022 | Contingent | $374,900$165/sqft |
Source: | ||
| 6/3/2022 | Listed for sale | $374,900+188.4%$165/sqft |
Source: | ||
| 10/27/1994 | Sold | $130,000$57/sqft |
Source: Public Record Report a problem | ||
| Year | Property taxes | Tax assessment |
|---|---|---|
| 2024 | -- | $34,000 +0% |
| 2023 | $9,524 +25.9% | $33,999 |
| 2022 | $7,563 +18.3% | $33,999 +25.5% |
| 2021 | $6,393 -0.2% | $27,088 |
| 2020 | $6,405 -1.5% | $27,088 -11% |
| 2019 | $6,504 -1.8% | $30,437 +16.2% |
| 2018 | $6,621 +1.3% | $26,185 |
| 2017 | $6,538 -0.1% | $26,185 |
| 2016 | $6,543 +17.4% | $26,185 +23.2% |
| 2015 | $5,573 +0.8% | $21,253 |
| 2014 | $5,528 -7.1% | $21,253 -8.7% |
| 2013 | $5,954 -3.3% | $23,281 -11.7% |
| 2012 | $6,155 +16.5% | $26,363 |
| 2011 | $5,285 +2.3% | $26,363 |
| 2010 | $5,167 +41.5% | $26,363 +20.5% |
| 2009 | $3,652 +17.7% | $21,875 -4% |
| 2008 | $3,103 +4.8% | $22,786 |
| 2007 | $2,961 -7.9% | $22,786 +4.4% |
| 2006 | $3,214 +9.1% | $21,820 |
| 2005 | $2,945 +4.6% | $21,820 |
| 2004 | $2,815 +0.1% | $21,820 +34% |
| 2003 | $2,812 +4.8% | $16,288 |
| 2002 | $2,682 +16.9% | $16,288 |
| 2001 | $2,294 +2.2% | $16,288 +18.9% |
| 2000 | $2,243 +0% | $13,704 |
| 1999 | $2,242 | $13,704 |
Source: MRED as distributed by MLS GRID. This data may not be complete. We recommend contacting the local school district to confirm school assignments for this home.
A local agent can set up tours, give advice and negotiate with sellers.
A local lender can help you make sure your offer is ready when you are.