$340,500
4 bd|2 ba|1.8k sqft
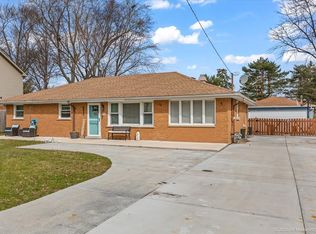
6441 W 112th St, Worth, IL 60482
Off Market
Zillow last checked:
Christina Barbaro 708-214-2445,
Keller Williams Preferred Rlty
Not available
Estimated sales range
Not available
Not available
| Date | Event | Price |
|---|---|---|
| 5/6/2019 | Sold | $215,500+3.2%$197/sqft |
Source: | ||
| 3/23/2019 | Pending sale | $208,872$191/sqft |
Source: Coldwell Banker Residential Brokerage - Orland Park #10303095 Report a problem | ||
| 3/23/2019 | Listed for sale | $208,872$191/sqft |
Source: Coldwell Banker Residential #10303095 Report a problem | ||
| 3/23/2019 | Pending sale | $208,872$191/sqft |
Source: Coldwell Banker Residential #10303095 Report a problem | ||
| 3/10/2019 | Listed for sale | $208,872+23.6%$191/sqft |
Source: Coldwell Banker Residential #10303095 Report a problem | ||
| 1/24/2018 | Sold | $169,000$154/sqft |
Source: Public Record Report a problem | ||
| 11/13/2017 | Sold | $169,000-0.5%$154/sqft |
Source: | ||
| 9/26/2017 | Pending sale | $169,900$155/sqft |
Source: Coldwell Banker Residential Brokerage - Oak Lawn #09716890 Report a problem | ||
| 9/21/2017 | Price change | $169,900-8.1%$155/sqft |
Source: Coldwell Banker Residential Brokerage - Oak Lawn #09716890 Report a problem | ||
| 8/29/2017 | Price change | $184,900-2.2%$169/sqft |
Source: Coldwell Banker Residential #09716890 Report a problem | ||
| 8/9/2017 | Listed for sale | $189,000$172/sqft |
Source: Coldwell Banker Residential #09716890 Report a problem | ||
| Year | Property taxes | Tax assessment |
|---|---|---|
| 2024 | -- | $20,000 +0% |
| 2023 | $7,160 +6% | $19,999 +25% |
| 2022 | $6,752 -4.4% | $16,005 -8% |
| 2021 | $7,064 +2.3% | $17,403 |
| 2020 | $6,906 +11.1% | $17,403 +17.5% |
| 2019 | $6,217 +0.4% | $14,812 |
| 2018 | $6,191 +0.1% | $14,812 -18.5% |
| 2017 | $6,182 +44.8% | $18,174 +51% |
| 2016 | $4,268 +3.2% | $12,035 |
| 2015 | $4,135 -10.8% | $12,035 -9.7% |
| 2014 | $4,634 -8.4% | $13,328 -14.9% |
| 2013 | $5,057 +3.3% | $15,662 |
| 2012 | $4,897 +2.6% | $15,662 |
| 2011 | $4,773 -11.6% | $15,662 -31.9% |
| 2010 | $5,400 +12.8% | $23,001 |
| 2009 | $4,785 +38% | $23,001 -5% |
| 2008 | $3,466 +2% | $24,211 +33.1% |
| 2007 | $3,400 +2.5% | $18,190 |
| 2006 | $3,317 +13.8% | $18,190 |
| 2005 | $2,914 +9.2% | $18,190 +35.3% |
| 2004 | $2,669 +2.8% | $13,440 |
| 2003 | $2,597 -14.6% | $13,440 -15% |
| 2002 | $3,041 +17.1% | $15,805 +12.9% |
| 2001 | $2,596 +4.4% | $13,995 |
| 2000 | $2,488 -0.1% | $13,995 |
| 1999 | $2,491 | $13,995 |
Source: MRED as distributed by MLS GRID. This data may not be complete. We recommend contacting the local school district to confirm school assignments for this home.
A local agent can set up tours, give advice and negotiate with sellers.
A local lender can help you make sure your offer is ready when you are.