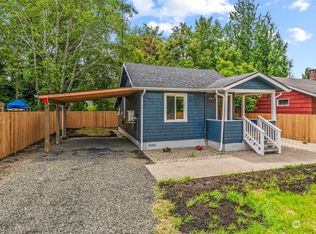
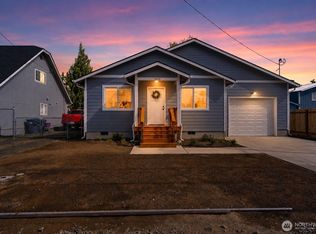
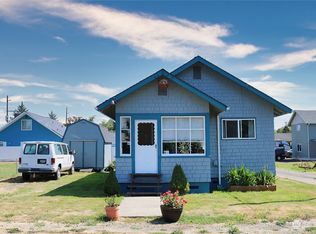
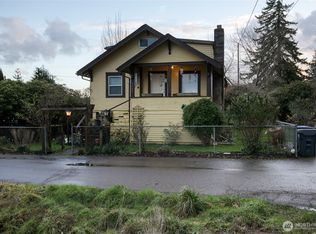
Enjoy a stable tenancy with this nicw duplex in a great location. 2 bedroom 1 bath makes for a nice place to live. Close to the ocen
Active
Listed by: PDG Services
Price cut: $30K (5/29)
$320,000
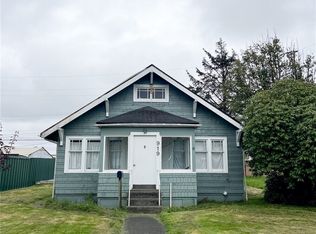
1007 Macfarlane, Aberdeen, WA 98520
4beds
2baths
3,020sqft
Duplex
Built in 1976
-- sqft lot
$-- Zestimate®
$106/sqft
$-- HOA
What's special
- 275 days |
- 256 |
- 10 |
Zillow last checked:
Listing updated:
Listed by:
Harold L Palmer Jr,
PDG Services
Source: NWMLS as distributed by MLS GRID,MLS#: 2438062
Loading...
Facts & features
Interior
Bedrooms & bathrooms
- Bedrooms: 4
- Bathrooms: 2
Heating
- Baseboard, Electric
Cooling
- None
Features
- Flooring: Laminate
- Has fireplace: No
Interior area
- Total structure area: 3,020
- Total interior livable area: 3,020 sqft
Property
Parking
- Total spaces: 8
- Parking features: Garage, Open
- Garage spaces: 4
- Uncovered spaces: 4
Lot
- Size: 5,998 Square Feet
Details
- Parcel number: 028000700500
- Zoning description: Jurisdiction: City
- Special conditions: Standard
Construction
Type & style
- Home type: MultiFamily
- Architectural style: Duplex
- Property subtype: Duplex
Materials
- Wood Siding
- Foundation: Block
- Roof: Composition
Condition
- Good
- Year built: 1976
Utilities & green energy
- Sewer: Sewer Connected
Community & HOA
Community
- Subdivision: South Aberdeen
Location
- Region: Aberdeen
Financial & listing details
- Price per square foot: $106/sqft
- Tax assessed value: $285,690
- Annual tax amount: $2,500
- Date on market: 11/25/2025
- Cumulative days on market: 215 days
- Listing terms: Conventional,See Remarks
Estimated market value
Not available
Estimated sales range
Not available
$2,327/mo
Price history
| Date | Event | Price |
|---|---|---|
| 5/29/2026 | Price change | $320,000-8.6%$106/sqft |
Source: | ||
| 4/23/2026 | Price change | $350,000-48.5%$116/sqft |
Source: | ||
| 2/26/2026 | Pending sale | $680,000$225/sqft |
Source: | ||
| 9/25/2025 | Listed for sale | $680,000+153.9%$225/sqft |
Source: | ||
| 3/24/2021 | Sold | $267,800-1.5%$89/sqft |
Source: | ||
| 2/27/2021 | Pending sale | $272,000$90/sqft |
Source: | ||
| 2/17/2021 | Listed for sale | $272,000+8.8%$90/sqft |
Source: | ||
| 9/27/2019 | Sold | $250,000+13.6%$83/sqft |
Source: Public Record Report a problem | ||
| 5/31/2019 | Sold | $220,000-4.3%$73/sqft |
Source: | ||
| 5/10/2019 | Pending sale | $230,000$76/sqft |
Source: Riley Jackson Real Estate Inc. #1450952 Report a problem | ||
| 5/9/2019 | Listed for sale | $230,000$76/sqft |
Source: Riley Jackson Real Estate Inc. #1450952 Report a problem | ||
Public tax history
| Year | Property taxes | Tax assessment |
|---|---|---|
| 2024 | $2,737 +13.2% | $285,690 |
| 2023 | $2,417 +24.4% | $285,690 +48.9% |
| 2022 | $1,943 +13.7% | $191,867 +30.8% |
| 2021 | $1,709 -46.9% | $146,643 -41.5% |
| 2020 | $3,217 +21.7% | $250,625 +22.8% |
| 2019 | $2,642 | $204,100 +15.5% |
| 2018 | $2,642 -1.5% | $176,645 +4.5% |
| 2017 | $2,684 +3.8% | $169,090 |
| 2016 | $2,585 | $169,090 -4.7% |
| 2014 | $2,585 +0.8% | $177,470 -3% |
| 2013 | $2,565 -5% | $182,890 -11.2% |
| 2011 | $2,699 +2.1% | $205,960 |
| 2010 | $2,645 +25.1% | $205,960 |
| 2009 | $2,113 +1.8% | $205,960 +36.9% |
| 2008 | $2,075 | $150,400 |
| 2007 | $2,075 -4.7% | $150,400 |
| 2006 | $2,179 +9.3% | $150,400 |
| 2005 | $1,993 +2.8% | $150,400 +19.5% |
| 2004 | $1,939 +4.5% | $125,860 |
| 2003 | $1,856 +29% | $125,860 |
| 2001 | $1,438 -4.7% | $125,860 +27.3% |
| 2000 | $1,509 | $98,850 |
Find assessor info on the county website
Monthly payment
Est. payment$--/mo
Payment breakdown
Explore the cost of this home by adjusting the details. Changes won't be saved.All calculations are estimates and provided by Zillow, Inc. for informational purposes only. Actual amounts may vary.
HOA fees may include property taxes on listings classified as Co-Ops. Contact the listing agent and/or owner for fee details.
Mortgage interest rates are dependent on a number of factors, including credit score, down payment, and repayment length. Interest rate data provided by Zillow Group Marketplace, Inc. as of 1/1/1970 from various mortgage lenders with which we have lead or other similar arrangements; the Estimated Payment is an average of those rates.
See how much you could borrow to make a competitive offer.
Climate risks
Neighborhood: 98520
Nearby schools
GreatSchools rating
- 3/10Stevens Elementary SchoolGrades: PK-5Distance: 0.8 mi
- 3/10Miller Junior High SchoolGrades: 6-8Distance: 0.7 mi
- 3/10J M Weatherwax High SchoolGrades: 9-12Distance: 1.1 mi

A local agent can set up tours, give advice and negotiate with sellers.
A local lender can help you make sure your offer is ready when you are.

- Washington
- Grays Harbor County
- Aberdeen
- 98520
- 1007 Macfarlane
Nearby cities
Nearby zip codes
Other Aberdeen Topics
