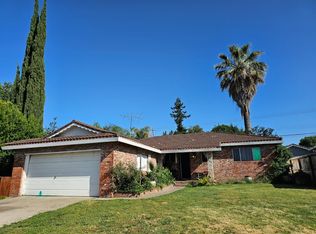
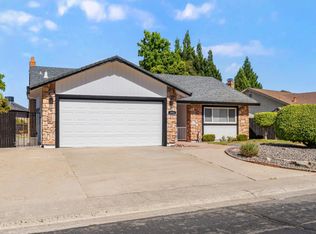
This 1554 square foot single family home has 3 bedrooms and 1.5 bathrooms. This home is located at 1103 Coloma Way, Roseville, CA 95661.
Foreclosed
Street View
Est. $589,000
1103 Coloma Way, Roseville, CA 95661
3beds
1baths
1,554sqft
SingleFamily
Built in 1957
0.26 Acres Lot
$589,000 Zestimate®
$379/sqft
$-- HOA
Overview
- 213 days
- 18
- 0
Facts & features
Interior
Bedrooms & bathrooms
- Bedrooms: 3
- Bathrooms: 1.5
Features
- Has fireplace: Yes
Interior area
- Total interior livable area: 1,554 sqft
Property
Parking
- Parking features: Carport, Garage - Attached
Features
- View description: None
Lot
- Size: 0.26 Acres
Details
- Parcel number: 014281016000
Construction
Type & style
- Home type: SingleFamily
Materials
- wood frame
Condition
- Year built: 1957
Community & HOA
Location
- Region: Roseville
Financial & listing details
- Price per square foot: $379/sqft
- Tax assessed value: $576,300
Foreclosure details
Estimated market value
$589,000
$536,000 - $636,000
$3,377/mo
Price history
| Date | Event | Price |
|---|---|---|
| 3/27/2026 | Sold | $377,038+33.2%$243/sqft |
Source: Public Record Report a problem | ||
| 6/13/2008 | Sold | $283,000+71%$182/sqft |
Source: Public Record Report a problem | ||
| 4/29/2008 | Sold | $165,454-46.3%$106/sqft |
Source: MetroList Services of CA #70088129 Report a problem | ||
| 7/9/2007 | Sold | $308,012-14.9%$198/sqft |
Source: Public Record Report a problem | ||
| 3/21/2006 | Sold | $362,000+39.8%$233/sqft |
Source: MetroList Services of CA #50082145 Report a problem | ||
| 6/25/2003 | Sold | $259,000$167/sqft |
Source: MetroList Services of CA #30010098 Report a problem | ||
Public tax history
| Year | Property taxes | Tax assessment |
|---|---|---|
| 2026 | -- | $576,300 +2% |
| 2025 | $5,855 +56.5% | $565,000 +55% |
| 2024 | $3,741 +2% | $364,419 +2% |
| 2023 | $3,667 -0.3% | $357,274 +2% |
| 2022 | $3,679 +2.4% | $350,270 +2% |
| 2021 | $3,593 +0.3% | $343,403 +1% |
| 2020 | $3,582 | $339,883 +2% |
| 2019 | $3,582 +5.4% | $333,219 +2% |
| 2018 | $3,398 +7.7% | $326,687 +8.5% |
| 2017 | $3,155 -1% | $301,000 +1.7% |
| 2016 | $3,188 +5.5% | $296,000 +5% |
| 2015 | $3,021 +1.7% | $282,000 +2.2% |
| 2014 | $2,969 | $276,000 +17.4% |
| 2013 | -- | $235,000 +10.8% |
| 2012 | -- | $212,000 -7% |
| 2011 | -- | $228,000 +0.2% |
| 2010 | -- | $227,559 -6.4% |
| 2009 | -- | $243,099 -4.6% |
| 2008 | -- | $254,855 -19.7% |
| 2007 | -- | $317,546 +15.7% |
| 2006 | -- | $274,492 +2% |
| 2005 | -- | $269,111 +2% |
| 2004 | -- | $263,835 +114.4% |
| 2003 | -- | $123,085 +2% |
| 2002 | -- | $120,673 +2% |
| 2001 | -- | $118,307 +2% |
| 2000 | -- | $115,988 |
Find assessor info on the county website
Monthly payment
Climate risks
Neighborhood: Cirby Side
Similar homes
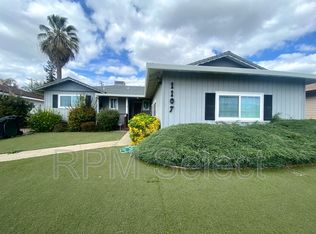
- $599,9003 bd2 ba1.1k sqft932 Coloma Way, Roseville, CA 95661For Sale
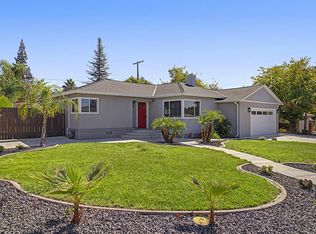 MLS ID #226124672, Tanya Bridges. MetroList Services of CA
- $--3 bd2 ba1.1k sqft1213 Gerry Way, Roseville, CA 95661Auction
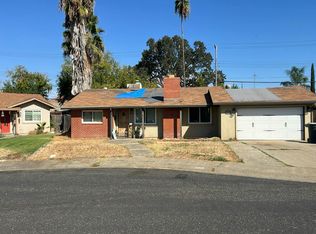 Auction.com 2
- $619,9003 bd2 ba1.6k sqft1416 Vista Creek Dr, Roseville, CA 95661For Sale
 MLS ID #226105639, Beth Conway. MetroList Services of CA
- $523,9003 bd2 ba1.5k sqft1318 Susan Cir, Roseville, CA 95661For Sale
 MLS ID #226030181, Joe Montoya. MetroList Services of CA
