This 2465 square foot single family home has 3 bedrooms and 3.0 bathrooms. This home is located at 1112 Sandwick Way, Folsom, CA 95630.
Pre-foreclosure
Street View
Est. $871,500
1112 Sandwick Way, Folsom, CA 95630
3beds
3baths
2,465sqft
SingleFamily
Built in 2001
7,448 Square Feet Lot
$871,500 Zestimate®
$354/sqft
$130/mo HOA
Overview
- 33 days
- 33
- 4
Facts & features
Interior
Bedrooms & bathrooms
- Bedrooms: 3
- Bathrooms: 3
Heating
- Other
Cooling
- Central
Features
- Has fireplace: Yes
Interior area
- Total interior livable area: 2,465 sqft
Property
Parking
- Parking features: Garage - Attached
Lot
- Size: 7,448 Square Feet
Details
- Parcel number: 07114500610000
Construction
Type & style
- Home type: SingleFamily
Materials
- wood frame
- Roof: Tile
Condition
- Year built: 2001
Community & HOA
HOA
- Has HOA: Yes
- HOA fee: $130 monthly
Location
- Region: Folsom
Financial & listing details
- Price per square foot: $354/sqft
- Tax assessed value: $907,800
Foreclosure details
Estimated market value
$871,500
$819,000 - $924,000
$3,554/mo
Price history
| Date | Event | Price |
|---|---|---|
| 6/15/2001 | Sold | $335,000$136/sqft |
Source: Public Record Report a problem | ||
Public tax history
| Year | Property taxes | Tax assessment |
|---|---|---|
| 2026 | -- | $907,800 +69.5% |
| 2025 | $7,787 +1.5% | $535,572 +2% |
| 2024 | $7,672 +3.7% | $525,072 +2% |
| 2023 | $7,395 +0.9% | $514,778 +2% |
| 2022 | $7,329 +0.8% | $504,685 +2% |
| 2021 | $7,272 +0.3% | $494,790 +1% |
| 2020 | $7,251 -0.7% | $489,718 +2% |
| 2019 | $7,300 +1.8% | $480,116 +2% |
| 2018 | $7,168 +5.1% | $470,703 +2% |
| 2017 | $6,823 -3% | $461,475 +2% |
| 2016 | $7,035 +6.2% | $452,427 +1.5% |
| 2015 | $6,622 | $445,632 +2% |
| 2014 | $6,622 | $436,903 +0.5% |
| 2013 | -- | $434,930 +4% |
| 2012 | -- | $418,044 |
| 2011 | -- | $418,044 +0.8% |
| 2010 | -- | $414,920 +8.1% |
| 2008 | -- | $383,753 +2% |
| 2007 | -- | $376,229 +2% |
| 2006 | -- | $368,853 +2% |
| 2005 | -- | $361,622 +2% |
| 2004 | -- | $354,533 +1.9% |
| 2003 | -- | $348,036 +528% |
| 2002 | -- | $55,421 +2% |
| 2001 | -- | $54,335 +2% |
| 2000 | -- | $53,270 |
Find assessor info on the county website
Monthly payment
Climate risks
Neighborhood: Empire Ranch

Similar homes
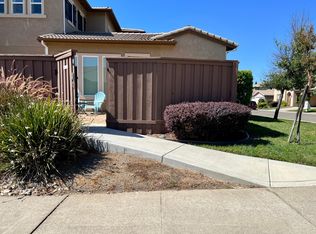
- $849,9004 bd3 ba2.5k sqft1453 Haddington Dr, Folsom, CA 95630For Sale
 MLS ID #226132769, Sergei Kucher. MetroList Services of CA
- $770,0003 bd2 ba1.7k sqft820 Morningside Dr, Folsom, CA 95630For Sale By Owner

- $775,0004 bd3 ba2.4k sqft1045 Callander Way, Folsom, CA 95630For Sale
 MLS ID #226124694, Alison Hull. MetroList Services of CA
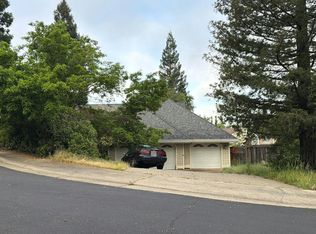
- $--4 bd2 ba2.9k sqft101 Allerton Ct, Folsom, CA 95630Auction
 Auction.com 2
