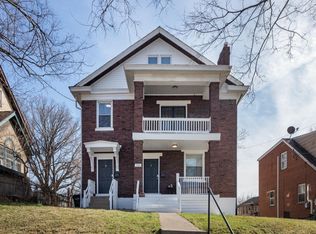
Fully Renovated and income producing duplex. Unit 1 is 1 bedroom, 1 bath and Unit 2 is 4 bedroom, 1 bath, plus a study! Newly added central air, laundry, back door to separate units and 2 new gas lines for furnaces and water heaters this year, in addition to other updates! Off street parking for up to 6 vehicles. Great investment opportunity.
Pending
$260,000
1125 Seton Ave, Cincinnati, OH 45205
5beds
2,730sqft
Multi Family, Duplex
Built in 1916
-- sqft lot
$-- Zestimate®
$95/sqft
$-- HOA
What's special
Newly added central air
- 41 days
- 71
- 4
Zillow last checked:
Listing updated:
Listed by:
Kristen M. Caudill 513-238-4904,
Sibcy Cline, Inc. 513-321-9922
Source: Cincy MLS,MLS#: 1895609 Originating MLS: Cincinnati Area Multiple Listing Service
Facts & features
Interior
Bedrooms & bathrooms
- Bedrooms: 5
- Bathrooms: 2
- Full bathrooms: 2
Heating
- Gas
Cooling
- Central Air
Features
- Windows: Double Hung
- Basement: Full
- Number of fireplaces: 2
- Fireplace features: Inoperable
Interior area
- Total structure area: 2,730
- Total interior livable area: 2,730 sqft
Property
Parking
- Total spaces: 6
- Parking features: Off Street, On Street, Driveway
- Uncovered spaces: 6
Features
- Stories: 3
- Patio & porch: Porch
- Fencing: Metal Fence
Lot
- Size: 5,880 Square Feet
- Dimensions: 50 x 120
Details
- Parcel number: 1740006004100
- Zoning description: Multi Family
Construction
Type & style
- Home type: MultiFamily
- Property subtype: Multi Family, Duplex
Materials
- Brick
- Foundation: Concrete Perimeter
- Roof: Shingle
Condition
- New construction: No
- Year built: 1916
Utilities & green energy
- Gas: Natural
- Sewer: Public Sewer
- Water: Public
Community & HOA
Location
- Region: Cincinnati
Financial & listing details
- Price per square foot: $95/sqft
- Tax assessed value: $191,000
- Annual tax amount: $40,396
- Date on market: 10/8/2026
- Listing terms: No Special Financing,Other
- Total actual rent: 2525
- Tenant pays: Heat
Estimated market value
Not available
Estimated sales range
Not available
Not available
Price history
| Date | Event | Price |
|---|---|---|
| 10/9/2026 | Pending sale | $260,000$95/sqft |
Source:  Cincy MLS #1895609 Report a problem | ||
| 10/8/2026 | Listed for sale | $260,000+10.6%$95/sqft |
Source: Cincy MLS #1895609 Report a problem | ||
| 2/20/2026 | Sold | $235,000-2.1%$86/sqft |
Source: Cincy MLS #1864020 Report a problem | ||
| 2/2/2026 | Pending sale | $240,000$88/sqft |
Source: Cincy MLS #1864020 Report a problem | ||
| 1/28/2026 | Listed for sale | $240,000$88/sqft |
Source: Cincy MLS #1864020 Report a problem | ||
| 1/26/2026 | Pending sale | $240,000$88/sqft |
Source: Cincy MLS #1864020 Report a problem | ||
| 1/23/2026 | Price change | $240,000-7.7%$88/sqft |
Source: Cincy MLS #1864020 Report a problem | ||
| 1/2/2026 | Price change | $260,000-7.1%$95/sqft |
Source: Cincy MLS #1864020 Report a problem | ||
| 12/12/2025 | Listed for sale | $280,000+46.6%$103/sqft |
Source: Cincy MLS #1864020 Report a problem | ||
| 1/7/2022 | Sold | $191,000+0.5%$70/sqft |
Source: Cincy MLS #1719080 Report a problem | ||
| 12/10/2021 | Pending sale | $190,000$70/sqft |
Source: Cincy MLS #1719080 Report a problem | ||
| 11/10/2021 | Price change | $190,000-5%$70/sqft |
Source: Cincy MLS #1719080 Report a problem | ||
| 10/14/2021 | Listed for sale | $200,000$73/sqft |
Source: Cincy MLS #1719080 Report a problem | ||
Public tax history
| Year | Property taxes | Tax assessment |
|---|---|---|
| 2025 | $4,180 +1.7% | $66,850 |
| 2024 | $4,109 -1.3% | $66,850 |
| 2023 | $4,162 +147.6% | $66,850 +182.5% |
| 2022 | $1,680 +1.7% | $23,660 |
| 2021 | $1,653 | $23,660 |
| 2020 | $1,653 +0.1% | $23,660 +10% |
| 2019 | $1,652 +3.9% | $21,511 |
| 2018 | $1,590 | $21,511 |
| 2017 | $1,590 +90.6% | $21,511 +75.6% |
| 2016 | $834 | $12,250 |
| 2015 | $834 -0.5% | $12,250 |
| 2014 | $839 -1.6% | $12,250 |
| 2013 | $853 -51.4% | $12,250 -53.9% |
| 2012 | $1,753 +2.5% | $26,593 |
| 2011 | $1,711 -6.8% | $26,593 -13% |
| 2010 | $1,836 +2.9% | $30,552 |
| 2009 | $1,784 +1.7% | $30,552 |
| 2008 | $1,754 -1.6% | $30,552 -14% |
| 2007 | $1,783 +1.1% | $35,525 |
| 2006 | $1,764 -1% | $35,525 |
| 2005 | $1,781 -0.2% | $35,525 +8.9% |
| 2003 | $1,785 +6.7% | $32,620 |
| 2002 | $1,673 +3.7% | $32,620 +8.6% |
| 2001 | $1,613 +3.4% | $30,030 |
| 2000 | $1,559 | $30,030 |
Find assessor info on the county website
Monthly payment
Est. payment
Payment breakdown
Explore the cost of this home by adjusting the details. Changes won't be saved.Climate risks
Neighborhood: West Price Hill

Similar homes
- $259,9007 bd3 ba3.4k sqft540 Grand Ave, Cincinnati, OH 45205For Sale

 MLS ID #1900340, Arthur Greenlee IV, eXp Realty. Cincy MLS
- $251,0004 bd2 ba2.1k sqft4330 Schulte Dr, Cincinnati, OH 45205For Sale
 MLS ID #1897522, Derrick M Garcia, Re/Max Time. Cincy MLS
- $--4 bd3 ba2.6k sqft4638 Glenway Ave, Cincinnati, OH 45238Auction
 Auction.com 2
- $340,0006 bd3 ba3.2k sqft540 Purcell Ave, Cincinnati, OH 45205For Sale
 MLS ID #1899564, Sarah N. Ragle, Plum Tree Realty. Cincy MLS
- $199,9003 bd3 ba2k sqft4526 Clearview Ave, Cincinnati, OH 45205For SaleMLS ID #1893241, Evan Johnson, Cutler Real Estate. Cincy MLS
- $199,9003 bd3 ba1.9k sqft4370 Saint Lawrence Ave, Cincinnati, OH 45205For SaleMLS ID #1891962, Michele R Mamo, eXp Realty. Cincy MLS
- $209,9004 bd3 ba1.6k sqft3417 Glenway Ave, Cincinnati, OH 45205For SaleMLS ID #1887357, Anne S. Uchtman, eXp Realty. Cincy MLS
- $160,0004 bd2 ba1.8k sqft1015 Purcell Ave, Cincinnati, OH 45205For SaleMLS ID #1863241, Adrienne N Shipman, Keller Williams Seven Hills Re. Cincy MLS
- $215,0003 bd1 ba1.5k sqft752 Considine Ave, Cincinnati, OH 45205For SaleMLS ID #1897725, Melissa B Hilvert, Comey & Shepherd. Cincy MLS
- $189,0003 bd2 ba2k sqft1103 Purcell Ave, Cincinnati, OH 45205For SaleMLS ID #1899300, Sean P Dennedy, Keller Williams Advisors. Cincy MLS
- $249,9003 bd2 ba2.1k sqft3418 Evanston Ave, Cincinnati, OH 45207For SaleMLS ID #1899933, Shawna D. Davis, Huff Realty. Cincy MLS
- $214,9003 bd2 ba1.7k sqft564 Considine Ave, Cincinnati, OH 45205For SaleMLS ID #1885922, Molly Thoms, Coldwell Banker Realty. Cincy MLS
- $259,9004 bd2 ba2.1k sqft1701 Sherman Ave, Cincinnati, OH 45212For SaleMLS ID #1888032, John C Meade, Keller Williams Advisors. Cincy MLS
- $169,9004 bd2 ba1.8k sqft1011 McPherson Ave, Cincinnati, OH 45205For SaleMLS ID #1873798, Kate McMinn, Real of Ohio. Cincy MLS
- $250,0005 bd3 ba2.5k sqft2200 Lawn Ave, Cincinnati, OH 45212For SaleMLS ID #1896555, Kyle Sticklen, Sibcy Cline, Inc.. Cincy MLS
- $269,0004 bd2 ba1.5k sqft3133 Harvard Ave, Cincinnati, OH 45207For SaleMLS ID #1896175, Jeff Smith, RE/MAX Victory + Affiliates. Cincy MLS
- $189,9003 bd2 ba1.8k sqft4049 Saint Williams Ave, Cincinnati, OH 45205For SaleMLS ID #1893666, Gordon G Green, eXp Realty. Cincy MLS
- $240,0003 bd2 ba2.1k sqft3227 Hildreth Ave, Cincinnati, OH 45211For SaleMLS ID #1898847, Steve Gardner, Coldwell Banker Realty. Cincy MLS
- $159,9003 bd2 ba1.9k sqft737 Hawthorne Ave, Cincinnati, OH 45205For SaleMLS ID #1891422, Michella A. Eldridge, Howard Hanna Real Estate Serv. Cincy MLS
