This stunning 4-bedroom, 4.5-bath residence in the Oakwood subdivision offers 4,206 sq. ft. of Living space. Thoughtfully designed with generous room sizes, premium finishes, and an exceptional layout, this home perfectly blends comfort with timeless elegance. Ideally located just moments from UT Martin and Martin Elementary, it provides both convenience and a sense of community. A perfect choice for those who value style and modern living.
Active
$599,900
126 Forest Dr, Martin, TN 38237
4beds
4,206sqft
Single Family Residence
Built in 2005
0.57 Acres Lot
$576,500 Zestimate®
$143/sqft
$-- HOA
What's special
Generous room sizesExceptional layoutPremium finishes
- 10 days
- 261
- 5
Likely to sell faster than
Zillow last checked:
Listing updated:
Listed by:
JOAN MOUSER 731-446-7320,
HAMLIN REAL ESTATE 731-456-2508
Source: RRAR as distributed by MLS GRID,MLS#: 46751
Facts & features
Interior
Bedrooms & bathrooms
- Bedrooms: 4
- Bathrooms: 4
- 1/2 bathrooms: 1
Primary bedroom
- Area: 208
- Dimensions: 13X16
Bedroom 1
- Area: 132
- Dimensions: 11X12
Bonus room
- Area: 210
- Dimensions: 21X10
Foyer
- Description: 17" Ceiling
Heating
- Central
Cooling
- Central Air
Appliances
- Included: Dishwasher, Refrigerator, Cooktop, Oven, Microwave
Features
- Flooring: Carpet, Ceramic Floor, Hardwood
Interior area
- Total interior livable area: 4,206 sqft
Property
Parking
- Total spaces: 2
- Parking features: Garage
- Garage spaces: 2
Features
- Stories: 2
Lot
- Size: 0.57 Acres
Details
- Parcel number: 008.00
Construction
Type & style
- Home type: SingleFamily
- Property subtype: Single Family Residence
Materials
- Foundation: Crawl Space
- Roof: Asphalt
Condition
- Year built: 2005
Utilities & green energy
- Sewer: Public Sewer
- Water: Public
Community & HOA
Community
- Subdivision: Oakwood
Location
- Region: Martin
Financial & listing details
- Price per square foot: $143/sqft
- Tax assessed value: $543,800
- Annual tax amount: $4,477
- Date on market: 10/24/2026
Estimated market value
$576,500
$548,000 - $605,000
$2,581/mo
Price history
| Date | Event | Price |
|---|---|---|
| 10/24/2026 | Listed for sale | $599,900-3.1%$143/sqft |
Source: RRAR as distributed by MLS GRID #46751 Report a problem | ||
| 9/25/2026 | Listing removed | $619,000$147/sqft |
Source: RRAR as distributed by MLS GRID #45466 Report a problem | ||
| 3/18/2026 | Listed for sale | $619,000-4%$147/sqft |
Source: RRAR as distributed by MLS GRID #45466 Report a problem | ||
| 6/24/2025 | Price change | $645,000-7.2%$153/sqft |
Source: RRAR as distributed by MLS GRID #45466 Report a problem | ||
| 5/5/2025 | Price change | $695,000-4.7%$165/sqft |
Source: RRAR as distributed by MLS GRID #45466 Report a problem | ||
| 3/24/2025 | Listed for sale | $729,000+3290.7%$173/sqft |
Source: RRAR as distributed by MLS GRID #45466 Report a problem | ||
| 1/31/2005 | Sold | $21,500$5/sqft |
Source: Public Record Report a problem | ||
Public tax history
| Year | Property taxes | Tax assessment |
|---|---|---|
| 2025 | $4,477 +9.1% | $135,950 |
| 2024 | $4,103 | $135,950 |
| 2023 | $4,103 +24% | $135,950 +53.1% |
| 2022 | $3,309 | $88,775 |
| 2021 | $3,309 | $88,775 |
| 2020 | $3,309 +10.4% | $88,775 |
| 2019 | $2,998 +3.6% | $88,775 +3.6% |
| 2018 | $2,892 -10.6% | $85,650 -3.8% |
| 2017 | $3,234 +0% | $89,050 |
| 2016 | $3,234 | $89,050 +0% |
| 2015 | $3,234 | $89,040 |
| 2014 | $3,234 | $89,040 |
| 2013 | $3,234 -0.5% | $89,040 |
| 2012 | $3,250 +3% | $89,040 -0.1% |
| 2011 | $3,156 | $89,172 |
| 2010 | $3,156 | $89,172 |
| 2009 | $3,156 | $89,172 |
| 2008 | $3,156 -11.8% | $89,172 |
| 2007 | $3,576 +24.8% | $89,172 +18.6% |
| 2006 | $2,864 +1266.9% | $75,180 +1266.9% |
| 2005 | $210 -20% | $5,500 -20% |
| 2004 | $262 +3.8% | $6,875 |
| 2002 | $252 | $6,875 |
| 2001 | -- | $6,875 -31.3% |
| 2000 | -- | $10,000 |
Find assessor info on the county website
Monthly payment
Est. payment
Payment breakdown
Explore the cost of this home by adjusting the details. Changes won't be saved.Climate risks
Neighborhood: 38237


Similar homes
- $460,9004 bd3 ba2.7k sqft142 Todd St, Martin, TN 38237For Sale
 MLS ID #46403, SHELIA BELL, TENNESSEE UNITED REAL ESTATE, LLC. RRAR as distributed by MLS GRID
- $474,9005 bd3 ba3.5k sqft1018 Stella Ruth Rd, Martin, TN 38237For Sale
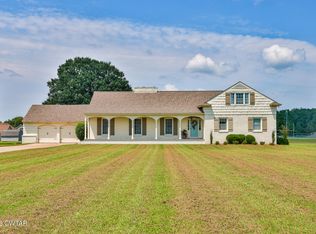 MLS ID #2603787, Samuel Freeman, Wendell Alexander Realty. CWTAR
- $495,0003 bd3 ba2.7k sqft133 Brundige Dr, Martin, TN 38237For Sale
 MLS ID #46548, MARVIN ALEXANDER, ALEXANDER AUCTIONS AND REAL ESTATE. RRAR as distributed by MLS GRID
- $365,0004 bd3 ba2.3k sqft138 Cherokee Dr, Martin, TN 38237For Sale By Owner
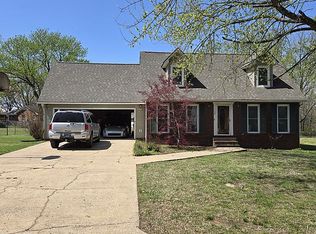
- $399,9006 bd4 ba2.7k sqft116 Summer St, Martin, TN 38237For Sale
 MLS ID #3179490, Dessie Hardee. RealTracs MLS as distributed by MLS GRID
