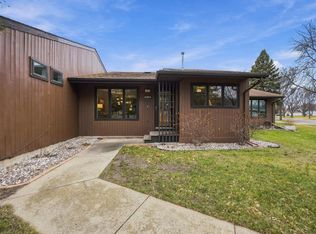
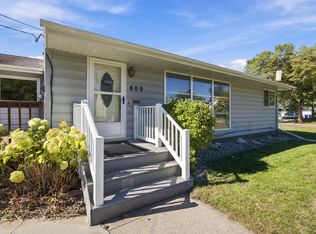
$--
5 bd2 ba2.1k sqft
1305 16 1/2 St S, Fargo, ND 58103
Sold

Zillow last checked:
Listing updated:
Julie Fournier 701-371-7281,
Berkshire Hathaway HomeServices Premier Properties 701-356-3600

Not available
Estimated sales range
Not available
Not available
| Date | Event | Price |
|---|---|---|
| 10/8/2026 | Listed for sale | $259,000+8%$126/sqft |
Source:  NorthstarMLS as distributed by MLS GRID #7155709 Report a problem | ||
| 8/31/2022 | Sold | -- |
Source: NorthstarMLS as distributed by MLS GRID #7419321 Report a problem | ||
| 7/21/2022 | Listing removed | -- |
Source: Zillow Rental Network Premium Report a problem | ||
| 6/29/2022 | Listed for rent | $925 |
Source: Zillow Rental Network Premium Report a problem | ||
| 6/11/2022 | Listed for sale | $239,900+20%$117/sqft |
Source:  FMARMLS #22-2691 Report a problem | ||
| 6/9/2022 | Listing removed | -- |
Source: Zillow Rental Network Premium Report a problem | ||
| 4/14/2022 | Listed for rent | $925 |
Source: Zillow Rental Network Premium Report a problem | ||
| 9/17/2020 | Listing removed | $199,900$97/sqft |
Source: RE/MAX Legacy Realty #20-3762 Report a problem | ||
| 9/2/2020 | Listed for sale | $199,900$97/sqft |
Source: RE/MAX Legacy Realty #20-3762 Report a problem | ||
| 8/26/2020 | Sold | -- |
Source: NorthstarMLS as distributed by MLS GRID #7408877 Report a problem | ||
| 7/13/2020 | Price change | $199,900-4.8%$97/sqft |
Source: RE/MAX Legacy Realty #20-3762 Report a problem | ||
| 7/6/2020 | Listed for sale | $209,900+46.9%$102/sqft |
Source: RE/MAX Legacy Realty #20-3762 Report a problem | ||
| 12/7/2009 | Listing removed | $142,900$70/sqft |
Source: First Realty #09-2237 Report a problem | ||
| 9/29/2009 | Listed for sale | $142,900$70/sqft |
Source: First Realty #09-2237 Report a problem | ||
| Year | Property taxes | Tax assessment |
|---|---|---|
| 2025 | $3,147 +6.5% | $227,600 +7% |
| 2024 | $2,955 +0.5% | $212,700 |
| 2023 | $2,940 +7.5% | $212,700 +10% |
| 2022 | $2,736 +20% | $193,400 +15.3% |
| 2021 | $2,280 +9.6% | $167,800 +10% |
| 2020 | $2,080 +10.9% | $152,500 +7% |
| 2019 | $1,875 +1.3% | $142,500 |
| 2018 | $1,851 +6.2% | $142,500 +110% |
| 2017 | $1,743 +6% | $67,850 +3% |
| 2016 | $1,645 +0.4% | $65,850 +7.5% |
| 2015 | $1,638 +10.9% | $61,250 +15% |
| 2014 | $1,477 -0.5% | $53,250 |
| 2013 | $1,484 -28.7% | $53,250 -6.8% |
| 2012 | $2,082 -4.2% | $57,150 -3% |
| 2011 | $2,172 +0.1% | $58,900 |
| 2010 | $2,170 +0.8% | $58,900 |
| 2009 | $2,153 +10.8% | $58,900 +39.6% |
| 2003 | $1,943 +5.7% | $42,200 +7% |
| 2001 | $1,839 | $39,450 |


A local agent can set up tours, give advice and negotiate with sellers.
A local lender can help you make sure your offer is ready when you are.