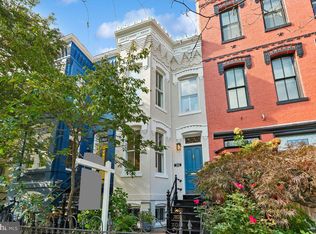
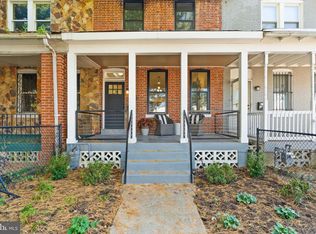
$963,200
3 bd2 ba1.4k sqft
1332 S Carolina Ave SE, Washington, DC 20003
Off Market
Likely to sell faster than
Zillow last checked:
Listing updated:
Eli Tucker 703-539-2529,
RLAH @properties,
Listing Team: Eli Residential Group, Co-Listing Agent: Tonya M Nelson 703-975-1570,
RLAH @properties

$1,295,400
$1.23M - $1.36M
$4,932/mo
| Date | Event | Price |
|---|---|---|
| 10/24/2026 | Listed for sale | $1,325,000+32.2%$784/sqft |
Source:  Bright MLS #DCDC2286404 Report a problem | ||
| 5/24/2018 | Sold | $1,002,000+0.5%$593/sqft |
Source: Public Record Report a problem | ||
| 4/25/2018 | Pending sale | $997,000$590/sqft |
Source: Long and Foster Real Estate #DC10214201 Report a problem | ||
| 4/19/2018 | Listed for sale | $997,000+20.4%$590/sqft |
Source: Evers & Co. Real Estate, A Long & Foster Company #1000419242 Report a problem | ||
| 8/27/2012 | Sold | $828,000+3.5%$490/sqft |
Source: Public Record Report a problem | ||
| 6/1/2012 | Listed for sale | $799,900+12.7%$473/sqft |
Source: Long and Foster Report a problem | ||
| 11/4/2008 | Sold | $710,000+79.3%$420/sqft |
Source: Public Record Report a problem | ||
| 1/17/2008 | Sold | $396,000-37.1%$234/sqft |
Source: Public Record Report a problem | ||
| 2/16/2006 | Sold | $630,000$373/sqft |
Source: Public Record Report a problem | ||
| Year | Property taxes | Tax assessment |
|---|---|---|
| 2026 | $9,472 -0.4% | $1,206,260 -0.2% |
| 2025 | $9,514 +2.5% | $1,209,180 +2.5% |
| 2024 | $9,285 +3.9% | $1,179,450 +3.9% |
| 2023 | $8,939 +6.5% | $1,135,650 +6.5% |
| 2022 | $8,396 +1.7% | $1,066,490 +1.8% |
| 2021 | $8,256 +2.8% | $1,047,640 +2.7% |
| 2020 | $8,031 +10.1% | $1,020,480 +9.6% |
| 2018 | $7,294 +3.1% | $931,480 +3% |
| 2017 | $7,074 +2% | $904,740 +1.9% |
| 2016 | $6,935 +6.4% | $887,630 +4.8% |
| 2015 | $6,520 +9.8% | $847,250 +4.2% |
| 2014 | $5,937 +9.8% | $812,880 +15.3% |
| 2013 | $5,406 +12.9% | $705,120 +0.9% |
| 2012 | $4,790 | $698,620 |
| 2011 | $4,790 +21% | $698,620 +31% |
| 2010 | $3,959 -11.2% | $533,250 -10% |
| 2009 | $4,461 -12.2% | $592,270 +2.6% |
| 2007 | $5,080 +257.8% | $577,290 +24.6% |
| 2006 | $1,420 +65.3% | $463,340 +21.1% |
| 2005 | $859 +12% | $382,740 +9.3% |
| 2004 | $767 +12% | $350,300 +27.9% |
| 2003 | $685 +25% | $273,870 +90% |
| 2002 | $548 -18.5% | $144,105 +3% |
| 2001 | $672 | $139,960 |
Source: Bright MLS. This data may not be complete. We recommend contacting the local school district to confirm school assignments for this home.


A local agent can set up tours, give advice and negotiate with sellers.