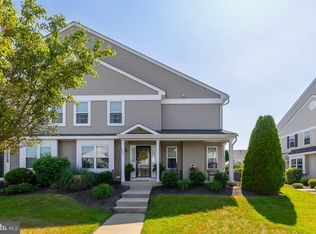
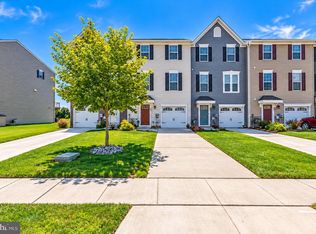
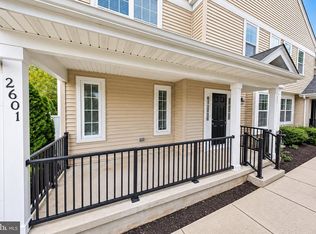
$339,900
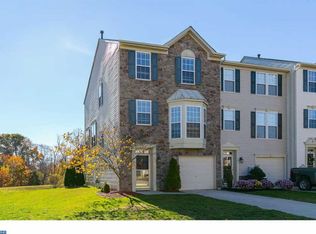
3 bd3 ba1.7k sqft
138 South Ave, Swedesboro, NJ 08085
Sold
Zillow last checked:
Listing updated:
Elma Guardiani 267-213-2162,
Coldwell Banker Realty

Not available
Estimated sales range
Not available
Not available
| Date | Event | Price |
|---|---|---|
| 11/7/2023 | Sold | $347,500-3.5%$197/sqft |
Source:  Bright MLS #NJGL2034292 Report a problem | ||
| 10/18/2023 | Pending sale | $360,000$204/sqft |
Source: Bright MLS #NJGL2034292 Report a problem | ||
| 10/16/2023 | Contingent | $360,000$204/sqft |
Source: Bright MLS #NJGL2034292 Report a problem | ||
| 10/16/2023 | Price change | $360,000+1.4%$204/sqft |
Source: Bright MLS #NJGL2034292 Report a problem | ||
| 10/6/2023 | Listed for sale | $355,000+101.1%$201/sqft |
Source: Bright MLS #NJGL2034292 Report a problem | ||
| 11/13/2018 | Sold | $176,500-5.9%$100/sqft |
Source: Public Record Report a problem | ||
| 9/15/2018 | Price change | $187,500-1.3%$106/sqft |
Source: Keller Williams Hometown Realty #1002070660 Report a problem | ||
| 7/19/2018 | Listed for sale | $190,000+22.6%$108/sqft |
Source: Keller Williams Realty - Swede #1002070660 Report a problem | ||
| 6/15/2017 | Sold | $155,000-2.8%$88/sqft |
Source: Public Record Report a problem | ||
| 3/21/2017 | Price change | $159,500-1.2%$90/sqft |
Source: A J Falciani Realty #6914034 Report a problem | ||
| 2/10/2017 | Price change | $161,500-4.9%$92/sqft |
Source: A J Falciani Realty #6914034 Report a problem | ||
| 1/18/2017 | Listed for sale | $169,900-23.6%$96/sqft |
Source: A J Falciani Realty #6914034 Report a problem | ||
| 9/11/2007 | Sold | $222,514+200.7%$126/sqft |
Source: Public Record Report a problem | ||
| 4/27/2007 | Sold | $74,000$42/sqft |
Source: Public Record Report a problem | ||
| Year | Property taxes | Tax assessment |
|---|---|---|
| 2026 | $7,705 +2.5% | $176,800 |
| 2025 | $7,518 | $176,800 |
| 2024 | $7,518 +0.9% | $176,800 |
| 2023 | $7,452 +0.2% | $176,800 |
| 2022 | $7,436 -0.1% | $176,800 |
| 2021 | $7,442 +5.5% | $176,800 |
| 2020 | $7,051 -1% | $176,800 |
| 2019 | $7,120 +0.5% | $176,800 |
| 2018 | $7,081 +0.1% | $176,800 |
| 2017 | $7,074 +3% | $176,800 |
| 2016 | $6,870 +6.5% | $176,800 |
| 2015 | $6,448 -4.8% | $176,800 +0.5% |
| 2014 | $6,772 +7.1% | $175,900 -6.3% |
| 2013 | $6,323 +4.7% | $187,800 |
| 2012 | $6,042 -6.1% | $187,800 |
| 2011 | $6,435 +5.9% | $187,800 +90.1% |
| 2010 | $6,075 +6.1% | $98,800 |
| 2009 | $5,725 | $98,800 |
Source: Bright MLS. This data may not be complete. We recommend contacting the local school district to confirm school assignments for this home.

A local agent can set up tours, give advice and negotiate with sellers.