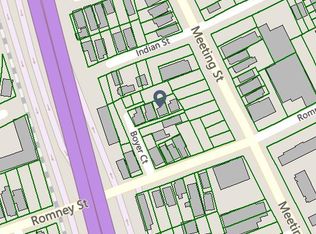
Tucked away on a quiet residential court just off Romney Street, 14 Boyer Ct is a beautifully refreshed 1915 historic single family home in Charleston's booming Upper Peninsula. Featuring extensive updates throughout, including refinished floors, fresh paint, updated kitchen and baths, storm-proof windows and doors, new gutters, and an upgraded crawlspace.With a strong rental history in years past, this property offers an opportunity for an investor or someone looking to live in one of Charleston's most up-and-coming areas. Minutes from Hampton Park, restaurants, breweries, and the upcoming Lowcountry Lowline.
Active
Price cut: $13.5K (10/20)
$599,000
14 Boyer Ct, Charleston, SC 29403
5beds
1,332sqft
Single Family Residence
Built in 1915
1,742 Square Feet Lot
$593,300 Zestimate®
$450/sqft
$-- HOA
What's special
Freshly touched-up paintNew guttersRecoated and refinished floorsBeautifully pressure-washed exteriorFresh paintStorm-proof windows and doorsNewly resealed toilets
- 42 days
- 941
- 63
Zillow last checked:
Listing updated:
Listed by:
The Boulevard Company
Source: CTMLS,MLS#: 26025537
Facts & features
Interior
Bedrooms & bathrooms
- Bedrooms: 5
- Bathrooms: 2
- Full bathrooms: 2
Heating
- Electric, Central
Features
- Has fireplace: No
Interior area
- Total structure area: 1,332
- Total interior livable area: 1,332 sqft
Property
Features
- Stories: 1
Lot
- Size: 1,742 Square Feet
Details
- Parcel number: 4631202069
Construction
Type & style
- Home type: SingleFamily
- Architectural style: Traditional
- Property subtype: Single Family Residence
Condition
- New construction: No
- Year built: 1915
Utilities & green energy
- Sewer: Public Sewer
- Water: Public
Community & HOA
Community
- Subdivision: Downtown
Location
- Region: Charleston
Financial & listing details
- Price per square foot: $450/sqft
- Tax assessed value: $561,300
- Annual tax amount: $1,758
- Date on market: 9/11/2026
- Listing terms: Cash,Conventional
Estimated market value
$593,300
$564,000 - $623,000
$4,312/mo
Price history
| Date | Event | Price |
|---|---|---|
| 10/20/2026 | Price change | $599,000-2.2%$450/sqft |
Source:  CTMLS #26025537 Report a problem | ||
| 10/14/2026 | Listed for rent | $3,300+10%$2/sqft |
Source: Zillow Rentals Report a problem | ||
| 10/8/2026 | Price change | $612,500-2%$460/sqft |
Source: CTMLS #26025537 Report a problem | ||
| 9/29/2026 | Price change | $625,000-13.8%$469/sqft |
Source: CTMLS #26025537 Report a problem | ||
| 9/22/2026 | Price change | $725,000-3.3%$544/sqft |
Source: CTMLS #26025537 Report a problem | ||
| 9/15/2026 | Price change | $749,999-6.8%$563/sqft |
Source: CTMLS #26025537 Report a problem | ||
| 9/11/2026 | Listed for sale | $804,999+187.5%$604/sqft |
Source: CTMLS #26025537 Report a problem | ||
| 9/15/2025 | Listing removed | $3,000$2/sqft |
Source: Zillow Rentals Report a problem | ||
| 9/9/2025 | Price change | $3,000-12.3%$2/sqft |
Source: Zillow Rentals Report a problem | ||
| 9/4/2025 | Price change | $3,420-5%$3/sqft |
Source: Zillow Rentals Report a problem | ||
| 8/30/2025 | Price change | $3,600-2.7%$3/sqft |
Source: Zillow Rentals Report a problem | ||
| 8/26/2025 | Price change | $3,700-5.1%$3/sqft |
Source: Zillow Rentals Report a problem | ||
| 8/19/2025 | Listed for rent | $3,900-7.1%$3/sqft |
Source: Zillow Rentals Report a problem | ||
| 8/18/2025 | Listing removed | $4,200$3/sqft |
Source: Zillow Rentals Report a problem | ||
| 8/14/2025 | Price change | $4,200-6.7%$3/sqft |
Source: Zillow Rentals Report a problem | ||
| 6/29/2025 | Listed for rent | $4,500-7.2%$3/sqft |
Source: Zillow Rentals Report a problem | ||
| 11/6/2024 | Listing removed | $4,850$4/sqft |
Source: Zillow Rentals Report a problem | ||
| 10/29/2024 | Listed for rent | $4,850+4750%$4/sqft |
Source: Zillow Rentals Report a problem | ||
| 2/24/2021 | Listing removed | -- |
Source: Owner Report a problem | ||
| 11/30/2020 | Price change | $100-95.7% |
Source: Owner Report a problem | ||
| 10/24/2020 | Price change | $2,300-4.2%$2/sqft |
Source: Owner Report a problem | ||
| 10/14/2020 | Listed for rent | $2,400$2/sqft |
Source: Owner Report a problem | ||
| 4/15/2019 | Sold | $280,000-1.8%$210/sqft |
Source: CTMLS #18032629 Report a problem | ||
| 3/15/2019 | Pending sale | $285,000+338.5%$214/sqft |
Source: RE/MAX Alliance #18032629 Report a problem | ||
| 5/7/2015 | Sold | $65,000+65.8%$49/sqft |
Source: Public Record Report a problem | ||
| 9/26/2014 | Sold | $39,200+86.7%$29/sqft |
Source: Public Record Report a problem | ||
| 4/24/2013 | Sold | $21,000$16/sqft |
Source: CTMLS #1030926 Report a problem | ||
Public tax history
| Year | Property taxes | Tax assessment |
|---|---|---|
| 2025 | $1,758 +14.7% | $12,880 +15% |
| 2024 | $1,532 +3.6% | $11,200 |
| 2023 | $1,479 -67.4% | $11,200 -33.3% |
| 2022 | $4,535 +1.2% | $16,800 |
| 2021 | $4,480 +192.5% | $16,800 +50% |
| 2020 | $1,531 | $11,200 -13.8% |
| 2019 | $1,531 | $13,000 -30.7% |
| 2017 | $1,531 -69.1% | $18,750 +380.8% |
| 2016 | $4,960 +360.7% | $3,900 |
| 2015 | $1,077 +4.4% | $3,900 |
| 2014 | $1,031 | -- |
| 2011 | $1,031 +1293.9% | -- |
| 2010 | $74 -25.3% | $1,490 |
| 2009 | $99 | $1,490 |
| 2008 | $99 -62.5% | $1,490 |
| 2006 | $264 -0.8% | $1,490 |
| 2005 | $267 -45.8% | $1,490 +2.8% |
| 2004 | $492 +8.9% | $1,450 |
| 2003 | $452 +2.2% | $1,450 |
| 2002 | $442 +45.6% | $1,450 +16% |
| 2000 | $303 | $1,250 |
Find assessor info on the county website
Monthly payment
Est. payment
Payment breakdown
Explore the cost of this home by adjusting the details. Changes won't be saved.Climate risks
Neighborhood: East Central
Nearby schools
Schools provided by the listing agent
- Elementary: Sanders Clyde
- Middle: Simmons Pinckney
- High: Burke
Source: CTMLS. This data may not be complete. We recommend contacting the local school district to confirm school assignments for this home.
Similar homes
- $595,0003 bd2 ba988 sqft93 Romney St, Charleston, SC 29403For Sale
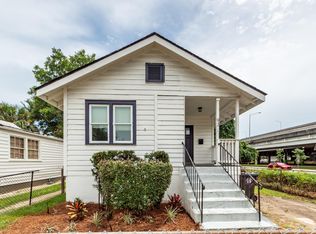
 MLS ID #26019324, Pam Paxton. CTMLS
- $599,0004 bd2 ba1.1k sqft37 F St APT A, Charleston, SC 29403For Sale
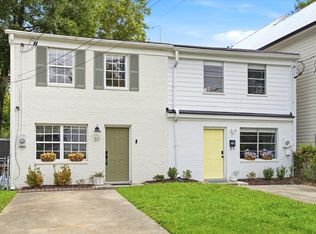 MLS ID #26022973, Alex Collins. CTMLS
- $820,0004 bd2 ba1.3k sqft2 Middleton Pl, Charleston, SC 29403For Sale
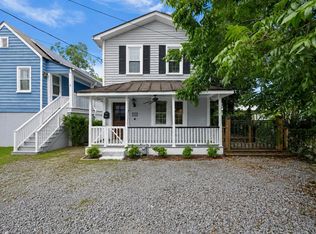 MLS ID #26021155, Tim Rogers. CTMLS
- $550,0003 bd2 ba1.9k sqft318 Millcreek Dr, Charleston, SC 29407For Sale
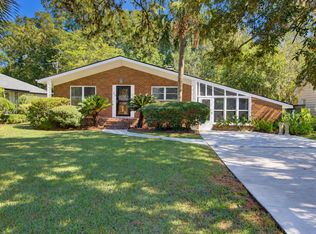 MLS ID #26028781, Suzie Smith. CTMLS
- $599,0003 bd2 ba1.2k sqft18 Hillcreek Blvd, Charleston, SC 29412For SaleMLS ID #26017565, William Barnwell. CTMLS
- $569,0002 bd2 ba1.2k sqft171 3rd Ave APT D, Charleston, SC 29403For SaleMLS ID #26023306, Phil Pedone. CTMLS
- $575,0004 bd2 ba1.7k sqft1 Rice Ct, Charleston, SC 29407For SaleMLS ID #26020989, Mary-hunter Englund. CTMLS
- $499,9004 bd2 ba1.4k sqft1006 Fiall St, Charleston, SC 29407For SaleMLS ID #26027812, Mikki Ramey. CTMLS
- $599,0003 bd2 ba1.4k sqft838 Targave Rd, Charleston, SC 29412For SaleMLS ID #26022527, Lyla Ambrose. CTMLS
- $594,9003 bd2 ba1.6k sqft818 W Madison Ave, Charleston, SC 29412For SaleMLS ID #26022680, Bryan Crabtree. CTMLS
- $629,9003 bd2 ba1.3k sqft1060 Pauline Ave, Charleston, SC 29412For SaleMLS ID #26020145, Joanne Harwell. CTMLS
- $650,0004 bd2 ba1.3k sqft428 Riverland Dr #A & B, Charleston, SC 29412For SaleMLS ID #26025926, Erin Brady. CTMLS
- $487,5003 bd2 ba1.4k sqft1836 Saint Julian Dr, Charleston, SC 29407For SaleMLS ID #26017123, Ed Hunnicutt. CTMLS
- $630,0003 bd3 ba1.6k sqft1423 Swamp Fox Ln, Charleston, SC 29412For SaleMLS ID #26016352, Ashley Rice. CTMLS
- $445,0003 bd2 ba1.2k sqft1609 Pineview Rd, Charleston, SC 29407For SaleMLS ID #26024205, Kristen Krause. CTMLS
- $435,0003 bd3 ba1.3k sqft42 Woodleaf Ct, Charleston, SC 29407For SaleMLS ID #26026632, Ryan Depoppe. CTMLS
- $500,0004 bd2 ba1.6k sqft1777 Banbury Rd, Charleston, SC 29414For SaleMLS ID #26021887, Christine Ulmer. CTMLS
- $429,5003 bd2 ba1.1k sqft1240 Camellia Rd, Charleston, SC 29407For SaleMLS ID #26025832, Jay Costa. CTMLS
- $700,0003 bd2 ba1.8k sqft1618 Patterson Ave, Charleston, SC 29412For SaleMLS ID #26026013, Amanda Gaskins. CTMLS
- $639,9992 bd2 ba984 sqft348 King St APT I, Charleston, SC 29401For SaleMLS ID #26020084, Gabe Jolly. CTMLS
