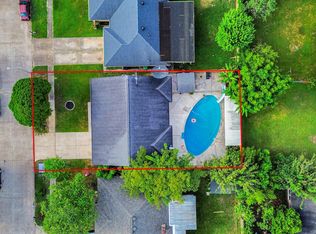
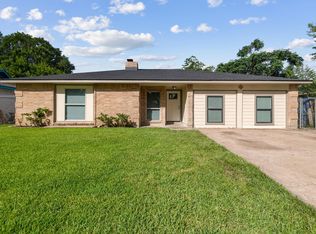
$175,700
3 bd2 ba1.2k sqft
15138 Kaler Rd, Houston, TX 77060
Off Market
Zillow last checked:
Listing updated:
Juan Carlos Hernandez TREC #0497201 281-660-9988,
REALM Real Estate Professionals - Galleria

$260,200
$247,000 - $273,000
$1,901/mo
| Date | Event | Price |
|---|---|---|
| 10/20/2026 | Listed for sale | $267,000+185.6%$144/sqft |
Source:  HAR #56373504 Report a problem | ||
| 10/12/2013 | Listing removed | $93,500$50/sqft |
Source: ZipRealty, Inc. #46685782 Report a problem | ||
| 7/4/2013 | Listed for sale | $93,500-6.4%$50/sqft |
Source: ZipRealty, Inc #46685782 Report a problem | ||
| 12/11/2012 | Listing removed | $99,900$54/sqft |
Source: Keller Williams Professionals #4400654 Report a problem | ||
| 6/27/2012 | Price change | $99,900-9.1%$54/sqft |
Source: Keller Williams Professionals #4400654 Report a problem | ||
| 6/13/2012 | Listed for sale | $109,900+22.1%$59/sqft |
Source: Keller Williams Professionals #4400654 Report a problem | ||
| 6/20/2011 | Price change | $90,000-5.3%$48/sqft |
Source: RE/MAX Legends #85116438 Report a problem | ||
| 4/29/2011 | Listed for sale | $95,000-4.9%$51/sqft |
Source: RE/MAX Legends #85116438 Report a problem | ||
| 2/22/2011 | Listing removed | $99,900$54/sqft |
Source: Delcor International Realty #54957399 Report a problem | ||
| 8/21/2010 | Listed for sale | $99,900-13.8%$54/sqft |
Source: Del Cor Properties #54957399 Report a problem | ||
| 12/9/2008 | Listing removed | $115,900$62/sqft |
Source: HAR #6661681 Report a problem | ||
| 10/17/2008 | Listed for sale | $115,900$62/sqft |
Source: HAR #6661681 Report a problem | ||
| Year | Property taxes | Tax assessment |
|---|---|---|
| 2025 | $2,822 +3611.3% | $225,026 -1.6% |
| 2024 | $76 | $228,739 +1% |
| 2023 | $76 | $226,411 +18.2% |
| 2022 | $76 | $191,619 +12.2% |
| 2021 | -- | $170,808 +11.8% |
| 2020 | $76 -96% | $152,843 +5% |
| 2019 | $1,881 -49.1% | $145,539 +6.3% |
| 2018 | $3,699 | $136,965 |
| 2017 | $3,699 +20.4% | $136,965 +18.3% |
| 2016 | $3,073 +21.7% | $115,824 +2.5% |
| 2015 | $2,525 | $113,045 +19.1% |
| 2014 | $2,525 | $94,904 +3.4% |
| 2013 | -- | $91,806 |
| 2012 | -- | $91,806 -13% |
| 2011 | -- | $105,495 |
| 2010 | -- | $105,495 -3.9% |
| 2009 | -- | $109,720 -10.9% |
| 2007 | -- | $123,119 +7.5% |
| 2006 | -- | $114,500 |
| 2005 | -- | $114,500 +3.1% |
| 2004 | -- | $111,100 +10% |
| 2003 | -- | $101,000 +9.9% |
| 2002 | -- | $91,900 +9.9% |
| 2001 | -- | $83,600 +10% |
| 2000 | -- | $76,000 |
Source: HAR. This data may not be complete. We recommend contacting the local school district to confirm school assignments for this home.

A local agent can set up tours, give advice and negotiate with sellers.