$95,000
2 bd|2 ba|1k sqft
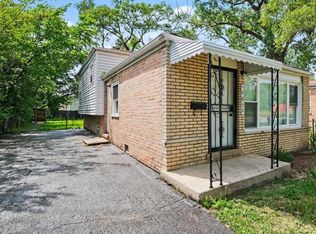
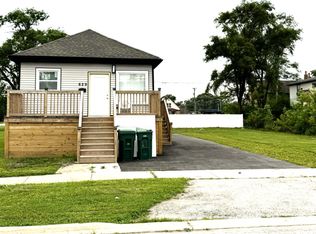
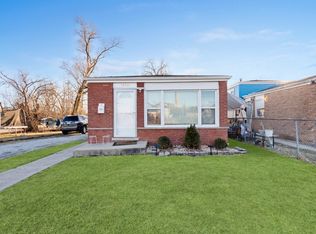
15343 8th Ave, Phoenix, IL 60426
Off Market
Zillow last checked:
Listing updated:
Sadeebra Watson 708-560-1087,
Coldwell Banker Realty
Not available
Estimated sales range
Not available
$2,115/mo
| Date | Event | Price |
|---|---|---|
| 6/20/2026 | Contingent | $135,000$104/sqft |
Source: | ||
| 5/22/2026 | Listed for sale | $135,000$104/sqft |
Source: | ||
| 4/24/2026 | Contingent | $135,000$104/sqft |
Source: | ||
| 4/19/2026 | Listed for sale | $135,000-10%$104/sqft |
Source: | ||
| 12/2/2023 | Listing removed | -- |
Source: Zillow Rentals Report a problem | ||
| 11/18/2023 | Listing removed | -- |
Source: | ||
| 11/17/2023 | Listed for rent | $1,850$1/sqft |
Source: Zillow Rentals Report a problem | ||
| 11/15/2023 | Listed for sale | $150,000$115/sqft |
Source: | ||
| 10/26/2023 | Contingent | $150,000$115/sqft |
Source: | ||
| 9/12/2023 | Price change | $150,000-9.1%$115/sqft |
Source: | ||
| 8/24/2023 | Price change | $165,000-5.7%$127/sqft |
Source: | ||
| 8/9/2023 | Listed for sale | $175,000-7.8%$135/sqft |
Source: | ||
| 7/26/2023 | Listing removed | -- |
Source: | ||
| 5/30/2023 | Listed for sale | $189,900+2134.1%$146/sqft |
Source: | ||
| 12/30/2003 | Sold | $8,500+21.4%$7/sqft |
Source: Agent Provided Report a problem | ||
| 7/23/1999 | Sold | $7,000$5/sqft |
Source: Agent Provided Report a problem | ||
| Year | Property taxes | Tax assessment |
|---|---|---|
| 2024 | -- | $2,024 |
| 2023 | $1,678 +54.1% | $2,024 +6.9% |
| 2022 | $1,088 -1.5% | $1,894 |
| 2021 | $1,104 -4.3% | $1,894 |
| 2020 | $1,155 +8.2% | $1,894 -2.3% |
| 2019 | $1,067 +4.2% | $1,938 |
| 2018 | $1,024 +3.7% | $1,938 |
| 2017 | $988 -3.9% | $1,938 +3.5% |
| 2016 | $1,028 +7.7% | $1,872 |
| 2015 | $954 +2.9% | $1,872 |
| 2014 | $927 -2.7% | $1,872 -9.3% |
| 2013 | $952 +21.2% | $2,065 |
| 2012 | $786 +13.4% | $2,065 |
| 2011 | $693 +19.6% | $2,065 +18.6% |
| 2010 | $580 +6.1% | $1,741 |
| 2009 | $546 -8.6% | $1,741 -16.6% |
| 2008 | $598 +14.9% | $2,087 -2.8% |
| 2007 | $520 +7% | $2,148 |
| 2006 | $486 +13.3% | $2,148 |
| 2005 | $429 +6.7% | $2,148 +41.3% |
| 2004 | $402 +1.9% | $1,520 |
| 2003 | $394 +3.1% | $1,520 |
| 2002 | $383 +71.9% | $1,520 +28.6% |
| 2001 | $223 -31% | $1,182 |
| 2000 | $323 +9.8% | $1,182 |
| 1999 | $294 | $1,182 |
Find assessor info on the county website
Source: MRED as distributed by MLS GRID. This data may not be complete. We recommend contacting the local school district to confirm school assignments for this home.
A local agent can set up tours, give advice and negotiate with sellers.
A local lender can help you make sure your offer is ready when you are.