This is a beautiful brick home in the hart of Southfield. Plenty of room in the backyard for children to play. This is a great property for a first time home buyer. Hardwood floors through the home, big beautiful living room that captures natural sunlight. In the Southfield school district.
For sale
$250,000
17584 Roxbury Ave, Southfield, MI 48075
3beds
2,214sqft
Single Family Residence
Built in 1949
8,276 Square Feet Lot
$247,600 Zestimate®
$113/sqft
$-- HOA
What's special
- 32 days
- 704
- 73
Zillow last checked:
Listing updated:
Listed by:
Austin Jackson 248-609-8000,
Keller Williams Paint Creek 248-609-8000
Source: Realcomp II,MLS#: 20261075773
Facts & features
Interior
Bedrooms & bathrooms
- Bedrooms: 3
- Bathrooms: 2
- Full bathrooms: 1
- 1/2 bathrooms: 1
Primary bedroom
- Level: Second
- Area: 210
- Dimensions: 14 X 15
Bedroom
- Level: Second
- Area: 110
- Dimensions: 11 X 10
Bedroom
- Level: Second
- Area: 110
- Dimensions: 11 X 10
Other
- Level: Second
Other
- Level: Entry
Dining room
- Level: Entry
- Area: 210
- Dimensions: 14 X 15
Kitchen
- Level: Entry
- Area: 120
- Dimensions: 12 X 10
Living room
- Level: Entry
- Area: 288
- Dimensions: 18 X 16
Heating
- Forced Air, Natural Gas
Features
- Basement: Finished
- Has fireplace: No
Interior area
- Total interior livable area: 2,214 sqft
- Finished area above ground: 1,456
- Finished area below ground: 758
Property
Parking
- Total spaces: 2.5
- Parking features: Twoand Half Car Garage, Detached
- Garage spaces: 2.5
Features
- Levels: Two
- Stories: 2
- Entry location: GroundLevelwSteps
- Pool features: None
Lot
- Size: 8,276 Square Feet
- Dimensions: 65 x 130
Details
- Parcel number: 2436152015
- Special conditions: Short Sale No,Standard
Construction
Type & style
- Home type: SingleFamily
- Architectural style: Colonial
- Property subtype: Single Family Residence
Materials
- Brick
- Foundation: Michigan Basement
Condition
- New construction: No
- Year built: 1949
Utilities & green energy
- Sewer: Public Sewer
- Water: Public
Community & HOA
Community
- Subdivision: MAGNOLIA 2
HOA
- Has HOA: No
Location
- Region: Southfield
Financial & listing details
- Price per square foot: $113/sqft
- Tax assessed value: $125,000
- Annual tax amount: $2,990
- Date on market: 9/18/2026
- Cumulative days on market: 32 days
- Listing agreement: Exclusive Right To Sell
- Listing terms: Cash,Conventional,FHA
Estimated market value
$247,600
$235,000 - $260,000
$2,301/mo
Price history
| Date | Event | Price |
|---|---|---|
| 9/19/2026 | Listed for sale | $250,000+284.6%$113/sqft |
Source:  Realcomp II #20261075773 Report a problem | ||
| 7/25/2013 | Sold | $65,000$29/sqft |
Source: Public Record Report a problem | ||
| 3/18/2013 | Listing removed | $65,000$29/sqft |
Source: Motion Real Estate & Investment Group, Inc. #212018795 Report a problem | ||
| 11/7/2012 | Pending sale | $65,000$29/sqft |
Source: Motion Real Estate & Investment Group, Inc. #212018795 Report a problem | ||
| 9/25/2012 | Listed for sale | $65,000+8.3%$29/sqft |
Source: Motion Real Estate & Investment Group, Inc. #212018795 Report a problem | ||
| 5/4/2012 | Listing removed | $60,000$27/sqft |
Source: MOTION REALTY #212018795 Report a problem | ||
| 3/11/2012 | Price change | $60,000-25%$27/sqft |
Source: Motion Real Estate & Investment Group, Inc. #212018795 Report a problem | ||
| 2/23/2012 | Listed for sale | $80,000-52.9%$36/sqft |
Source: Motion Real Estate & Investment Group, Inc. #212018795 Report a problem | ||
| 1/22/2007 | Sold | $170,000+14.3%$77/sqft |
Source: Public Record Report a problem | ||
| 8/22/2006 | Sold | $148,739+7.8%$67/sqft |
Source: Public Record Report a problem | ||
| 8/4/1998 | Sold | $138,000$62/sqft |
Source: Public Record Report a problem | ||
Public tax history
| Year | Property taxes | Tax assessment |
|---|---|---|
| 2025 | -- | $105,420 +0.5% |
| 2024 | -- | $104,870 +9.3% |
| 2023 | -- | $95,980 +11.4% |
| 2022 | -- | $86,120 +10.8% |
| 2021 | -- | $77,710 +24.4% |
| 2020 | -- | $62,460 +13.1% |
| 2019 | -- | $55,220 +9.3% |
| 2018 | -- | $50,540 +26.2% |
| 2015 | -- | $40,050 +10.2% |
| 2014 | -- | $36,330 -5.9% |
| 2011 | -- | $38,600 -43.1% |
| 2010 | -- | $67,810 |
| 2009 | -- | $67,810 -1.9% |
| 2003 | -- | $69,110 +5.4% |
| 2002 | -- | $65,550 +17.6% |
| 2001 | $3,462 +1.1% | $55,730 +3.2% |
| 2000 | $3,424 | $54,010 |
Find assessor info on the county website
Monthly payment
Est. payment
Payment breakdown
Explore the cost of this home by adjusting the details. Changes won't be saved.Climate risks
Neighborhood: 48075

Similar homes
- $259,0004 bd3 ba2.6k sqft17620 Cornell Rd, Southfield, MI 48075For Sale
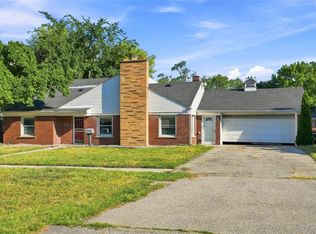
 MLS ID #20261082039, Mikhail Grigoryan, Detroit Progress Realty LLC. Realcomp II
- $--3 bd2 ba1.8k sqft17309 Melrose St, Southfield, MI 48075Auction
 Auction.com 2
- $284,9994 bd3 ba2.4k sqft17580 Dorset Ave, Southfield, MI 48075For Sale
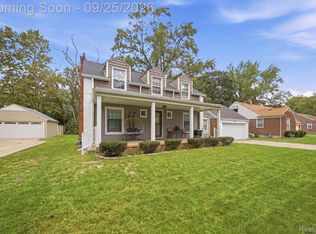 MLS ID #20261076416, Jennifer Hemstrom, Thrive Realty Company. Realcomp II
- $265,0003 bd3 ba1.7k sqft15718 George Washington Dr, Southfield, MI 48075For Sale
 MLS ID #20261025385, Sheena R Franklin, REMAX City Centre. Realcomp II
- $239,0003 bd1 ba1.5k sqft17889 Bonstelle Ave, Southfield, MI 48075For SaleMLS ID #20261074035, James J Toma, Brookstone, Realtors LLC. Realcomp II
- $269,0003 bd1 ba1.5k sqft23456 Lee Baker Dr, Southfield, MI 48075For SaleMLS ID #20261076543, Miroslav Gavriloski, REALTEAM Real Estate. Realcomp II
- $264,9004 bd3 ba2.3k sqft21613 Wallace Dr, Southfield, MI 48075For SaleMLS ID #20261079562, Jeff Glover, KW Professionals. Realcomp II
- $235,0003 bd2 ba3k sqft24319 Tamarack Trl, Southfield, MI 48075For Sale
 MLS ID #26051696, John McArdle, Remerica Hometown One. MichRIC
- $180,0003 bd4 ba2.3k sqft19209 Starlane St, Southfield, MI 48075For SaleMLS ID #20261084136, Milton Duerod Jr, Motion Realty. Realcomp II
- $205,0003 bd2 ba2.3k sqft19031 Greenwald Dr, Southfield, MI 48075For SaleMLS ID #20261065888, Joyce L Aldridge Hunter, Community Choice Realty Inc. Realcomp II
- $249,9993 bd2 ba2k sqft22030 Church St, Oak Park, MI 48237For SaleMLS ID #20261083813, Parker McInnis, Oak and Stone Real Estate. Realcomp II
- $300,0003 bd3 ba1.5k sqft19980 Dorset St, Southfield, MI 48075For SaleMLS ID #20261081935, Diana Mamo, Community Choice Realty Inc. Realcomp II
- $239,0004 bd2 ba1.3k sqft19490 Goldwin St, Southfield, MI 48075For SaleMLS ID #20261067941, Avrohom Knopf, KW Domain. Realcomp II
- $315,0004 bd2 ba2.2k sqft19655 Saxton Ave, Southfield, MI 48075For SaleMLS ID #20261080784, Jeff Glover, KW Professionals. Realcomp II
- $289,9003 bd2 ba1.5k sqft24735 Lathrup Blvd, Southfield, MI 48075For SaleMLS ID #20261070324, Heather S Poyhonen, Avenue Group Homes, LLC. Realcomp II
- $300,0003 bd2 ba1.8k sqft25685 Grand Concourse St, Southfield, MI 48075For SaleMLS ID #20261080631, Kyle Poe, eXp Realty Best Life and Company. Realcomp II
- $194,9004 bd1 ba1.2k sqft20195 Westhampton Ave, Southfield, MI 48075For SaleMLS ID #20261084909, Erica Skapyak, JWH Real Estate LLC. Realcomp II
- $229,0003 bd1 ba1.1k sqft21148 Midway Ave, Southfield, MI 48075For SaleMLS ID #20261058823, Zachary Sims, Ambassador Real Estate Inc. Realcomp II
