This 1850 square foot single family home has 3 bedrooms and 2.0 bathrooms. This home is located at 2121 Beal Rd, Plant City, FL 33567.
Pre-foreclosure
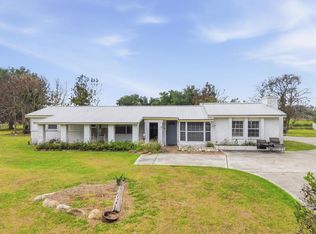
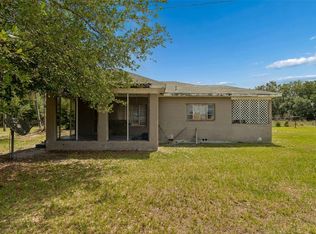
Street View
Est. $450,000
2121 Beal Rd, Plant City, FL 33567
3beds
2baths
1,850sqft
SingleFamily
Built in 1987
2.31 Acres Lot
$450,000 Zestimate®
$243/sqft
$-- HOA
Overview
- 140 days |
- 43 |
- 3 |
Facts & features
Interior
Bedrooms & bathrooms
- Bedrooms: 3
- Bathrooms: 2
Heating
- Other
Cooling
- Central
Features
- Flooring: Tile, Carpet, Concrete, Hardwood
- Has fireplace: Yes
Interior area
- Total interior livable area: 1,850 sqft
Property
Parking
- Parking features: Garage
Features
- Exterior features: Stucco
Lot
- Size: 2.31 Acres
Details
- Parcel number: 222923ZZZ000005060800U
Construction
Type & style
- Home type: SingleFamily
- Architectural style: Contemporary
Materials
- masonry
- Roof: Composition
Condition
- Year built: 1987
Community & HOA
Location
- Region: Plant City
Financial & listing details
- Price per square foot: $243/sqft
- Tax assessed value: $326,164
- Annual tax amount: $6,550
Visit our professional directory to find a foreclosure specialist in your area that can help with your home search.
Find a foreclosure agentForeclosure details
Estimated market value
$450,000
$401,000 - $495,000
$2,345/mo
Price history
| Date | Event | Price |
|---|---|---|
| 2/15/2023 | Sold | $50,000$27/sqft |
Source: Public Record Report a problem | ||
Public tax history
| Year | Property taxes | Tax assessment |
|---|---|---|
| 2025 | $6,550 +6.6% | $326,164 +1.4% |
| 2024 | $6,142 +185.3% | $321,736 +136.7% |
| 2023 | $2,153 +7.3% | $135,924 +3% |
| 2022 | $2,006 +1.6% | $131,965 +3% |
| 2021 | $1,974 +4.3% | $128,121 +1.4% |
| 2020 | $1,892 +4.9% | $126,352 +2.3% |
| 2019 | $1,803 | $123,511 +1.9% |
| 2018 | $1,803 +5% | $121,208 -20.9% |
| 2017 | $1,718 +1.6% | $153,214 +31.8% |
| 2016 | $1,691 +0.4% | $116,273 +0.7% |
| 2015 | $1,683 | $115,465 +0.8% |
| 2014 | $1,683 | $114,549 +1.5% |
| 2013 | $1,683 +0.7% | $112,856 +1.7% |
| 2012 | $1,672 +0.1% | $110,970 +0.3% |
| 2011 | $1,670 +3.1% | $110,677 +1.5% |
| 2010 | $1,620 +3.7% | $109,041 +2.7% |
| 2009 | $1,562 +0.5% | $106,174 +0.1% |
| 2008 | $1,554 -12.2% | $106,068 +3% |
| 2007 | $1,769 -4% | $102,979 +2.5% |
| 2006 | $1,843 +0.5% | $100,467 +3% |
| 2005 | $1,834 | $97,541 +3% |
| 2004 | -- | $94,700 +1.9% |
| 2003 | $406 | $92,934 +2.4% |
| 2002 | -- | $90,756 +1.6% |
| 2001 | -- | $89,327 -2.3% |
| 2000 | $1,658 | $91,452 |
Find assessor info on the county website
Monthly payment
Estimated monthly payment$1,822
All calculations are estimates and provided by Zillow, Inc. for informational purposes only. Actual amounts may vary.
HOA fees may include property taxes on listings classified as Co-Ops. Contact the listing agent and/or owner for fee details.
Mortgage interest rates are dependent on a number of factors, including credit score, down payment, and repayment length. Interest rate data provided by Zillow Group Marketplace, Inc. as of 1/1/1970 from various mortgage lenders with which we have lead or other similar arrangements; the Estimated Payment is an average of those rates.
See how much you could borrow to make a competitive offer.
Climate risks
Neighborhood: 33567
Nearby schools
GreatSchools rating
- 7/10Trapnell Elementary SchoolGrades: PK-5Distance: 3.7 mi
- 2/10Turkey Creek Middle SchoolGrades: 6-8Distance: 5.2 mi
- 4/10Durant High SchoolGrades: 9-12Distance: 6.3 mi


- Florida
- Hillsborough County
- Plant City
- 33567
- 2121 Beal Rd
Nearby cities
Nearby zip codes
Other Plant City Topics
