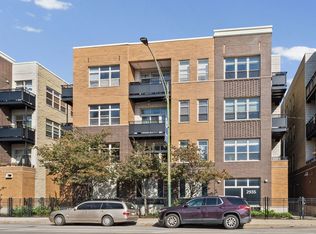
$840,900
2 bd1 ba17k sqft
3235 N Oakley Ave, Chicago, IL 60618
Off Market
Listing description withheld by the listing agent.
Zillow last checked:
Listing updated:
Stephanie Englund Siegel (773)750-6423,
Compass

Not available
Estimated sales range
Not available
Not available
| Date | Event | Price |
|---|---|---|
| 11/7/2026 | Listed for sale | $399,000+38.5% |
Source:  MRED as distributed by MLS GRID #12802872 Report a problem | ||
| 5/14/2021 | Sold | $288,000-1.4% |
Source: MRED as distributed by MLS GRID #11026153 Report a problem | ||
| 4/3/2021 | Contingent | $292,000 |
Source: MRED as distributed by MLS GRID #11026153 Report a problem | ||
| 3/19/2021 | Listed for sale | $292,000+11.2% |
Source: MRED as distributed by MLS GRID #11026153 Report a problem | ||
| 11/7/2017 | Sold | $262,500+1.4% |
Source: MRED as distributed by MLS GRID #09754362 Report a problem | ||
| 9/30/2017 | Pending sale | $259,000 |
Source: @properties #09754362 Report a problem | ||
| 9/19/2017 | Listed for sale | $259,000+10.2% |
Source: @properties #09754362 Report a problem | ||
| 2/11/2016 | Sold | $235,000-2.1% |
Source: Public Record Report a problem | ||
| 1/25/2016 | Pending sale | $240,000 |
Source: @properties #09119284 Report a problem | ||
| 9/26/2015 | Price change | $240,000-4% |
Source: @properties #09023131 Report a problem | ||
| 8/27/2015 | Listed for sale | $250,000+10.9% |
Source: @properties #09023131 Report a problem | ||
| 8/17/2012 | Sold | $225,500-4% |
Source: Public Record Report a problem | ||
| 6/13/2012 | Listed for sale | $235,000-4.1% |
Source: @properties #08090052 Report a problem | ||
| 4/20/2010 | Sold | $245,000+9.9% |
Source: Public Record Report a problem | ||
| 3/31/2004 | Sold | $223,000 |
Source: Public Record Report a problem | ||
| Year | Property taxes | Tax assessment |
|---|---|---|
| 2024 | $5,697 +8% | $28,354 +13.4% |
| 2023 | $5,274 +2.6% | $24,998 |
| 2022 | $5,142 +2.3% | $24,998 |
| 2021 | $5,027 +3.4% | $24,998 +14.6% |
| 2020 | $4,860 +1% | $21,817 -8.9% |
| 2019 | $4,812 +1.7% | $23,953 |
| 2018 | $4,732 -4.4% | $23,953 +4.1% |
| 2017 | $4,951 +7.5% | $22,999 |
| 2016 | $4,606 +9.3% | $22,999 |
| 2015 | $4,214 +0.3% | $22,999 +1.6% |
| 2014 | $4,202 +2% | $22,647 |
| 2013 | $4,119 +1.4% | $22,647 |
| 2012 | $4,064 +0.6% | $22,647 -9.1% |
| 2011 | $4,039 +20.9% | $24,923 |
| 2010 | $3,341 +12.8% | $24,923 |
| 2009 | $2,961 +3.9% | $24,923 +9.6% |
| 2008 | $2,850 +3.2% | $22,730 |
| 2007 | $2,762 +0.8% | $22,730 |
| 2006 | $2,741 -11.6% | $22,730 +19.7% |
| 2005 | $3,102 +1% | $18,983 |
| 2004 | $3,071 +73.6% | $18,983 |
| 2003 | $1,769 -5.4% | $18,983 +55.2% |
| 2002 | $1,870 -11.7% | $12,231 |
| 2001 | $2,118 -8.1% | $12,231 |
| 2000 | $2,304 | $12,231 +2% |
| 1999 | -- | $11,996 |
Source: MRED as distributed by MLS GRID. This data may not be complete. We recommend contacting the local school district to confirm school assignments for this home.

A local agent can set up tours, give advice and negotiate with sellers.
A local lender can help you make sure your offer is ready when you are.