This 2082 square foot single family home has 3 bedrooms and 2.0 bathrooms. This home is located at 2338 Sunninglow St, Pt Charlotte, FL 33948.
Pre-foreclosure
Est. $366,800
2338 Sunninglow St, Pt Charlotte, FL 33948
3beds
2,082sqft
SingleFamily
Built in 1989
9,999 Square Feet Lot
$366,800 Zestimate®
$176/sqft
$-- HOA
Overview
- 94 days
- 17
- 4
Facts & features
Interior
Bedrooms & bathrooms
- Bedrooms: 3
- Bathrooms: 2
- Full bathrooms: 2
Heating
- Heat pump, Electric
Cooling
- Central
Features
- Has fireplace: No
Interior area
- Total interior livable area: 2,082 sqft
Property
Parking
- Parking features: Garage - Attached
Features
- Exterior features: Cement / Concrete
Lot
- Size: 9,999 Square Feet
Details
- Parcel number: 402218430008
Construction
Type & style
- Home type: SingleFamily
Materials
- Concrete Block
- Foundation: Slab
- Roof: Composition
Condition
- Year built: 1989
Community & HOA
Location
- Region: Pt Charlotte
Financial & listing details
- Price per square foot: $176/sqft
- Tax assessed value: $357,987
- Annual tax amount: $3,694
Foreclosure details
Estimated market value
$366,800
$337,000 - $396,000
$2,942/mo
Price history
| Date | Event | Price |
|---|---|---|
| 8/30/2022 | Listing removed | -- |
Source:  Stellar MLS #C7460662 Report a problem | ||
| 5/14/2022 | Listed for sale | $469,900+110.7%$226/sqft |
Source: Stellar MLS #C7460662 Report a problem | ||
| 7/31/2017 | Sold | $223,000+65.2%$107/sqft |
Source: Stellar MLS #D5912470 Report a problem | ||
| 3/11/2016 | Sold | $135,000-10.6%$65/sqft |
Source: Stellar MLS #D5909898 Report a problem | ||
| 12/11/2002 | Sold | $151,000+15.3%$73/sqft |
Source: Public Record Report a problem | ||
| 7/5/2000 | Sold | $131,000+44.3%$63/sqft |
Source: Public Record Report a problem | ||
| 12/20/1996 | Sold | $90,800$44/sqft |
Source: Public Record Report a problem | ||
Public tax history
| Year | Property taxes | Tax assessment |
|---|---|---|
| 2025 | $3,694 +2.2% | $233,848 +2.9% |
| 2024 | $3,614 +0.9% | $227,258 +3% |
| 2023 | $3,583 +3.6% | $220,639 +3% |
| 2022 | $3,459 0% | $214,213 +3% |
| 2021 | $3,459 +2% | $207,974 +1.4% |
| 2020 | $3,392 +3.2% | $205,103 +2.3% |
| 2019 | $3,287 +2.8% | $200,492 -2.9% |
| 2018 | $3,197 | $206,505 +9.9% |
| 2017 | $3,197 -11.1% | $187,910 +72% |
| 2016 | $3,596 +114.2% | $109,255 +0.8% |
| 2015 | $1,678 +0.8% | $108,384 +0.8% |
| 2014 | $1,665 +43.7% | $107,524 +3.2% |
| 2013 | $1,159 +4.6% | $104,164 -2.5% |
| 2012 | $1,108 -2.9% | $106,785 |
| 2011 | $1,140 -13.7% | $106,785 -7.7% |
| 2010 | $1,321 -4.9% | $115,694 -7.9% |
| 2009 | $1,389 | $125,609 -21.7% |
| 2007 | -- | $160,318 |
| 2006 | -- | $160,318 +6.1% |
| 2005 | -- | $151,116 +21.6% |
| 2004 | -- | $124,254 |
| 2003 | -- | $124,254 +12.8% |
| 2002 | $1,711 +2.9% | $110,115 +1.6% |
| 2001 | $1,663 +17.2% | $108,381 +14.4% |
| 2000 | $1,419 | $94,717 |
Find assessor info on the county website
Monthly payment
Climate risks
Neighborhood: 33948
- $18,000-- bd-- ba-- sqft2330 Sunninglow St, Pt Charlotte, FL 33948Off Market
- $18,000-- bd-- ba-- sqft2346 Sunninglow St, Pt Charlotte, FL 33948Off Market
- $291,9003 bd2 ba1.5k sqft2337 Pellam Blvd, Port Charlotte, FL 33948Off Market
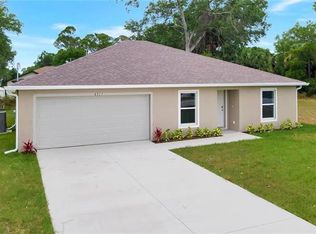
- $213,9002 bd2 ba1.1k sqft2329 Pellam Blvd, Pt Charlotte, FL 33948Off Market
Similar homes
- $375,0003 bd3 ba1.4k sqft18414 AVON AVENUE, PORT CHARLOTTE, FL 33948For Sale
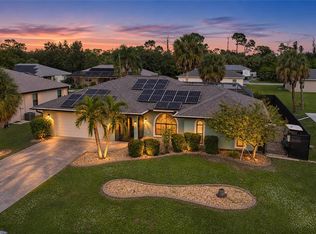
 MLS ID #D6149558, Jayson Burtch, CENTURY 21 SUNBELT REALTY. Stellar MLS
- $369,0003 bd2 ba1.3k sqft2401 TAMARIND STREET, PORT CHARLOTTE, FL 33948For Sale
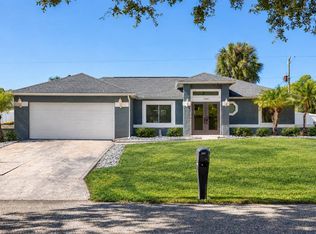 MLS ID #A4711212, Sasha Volosevych, CALL IT CLOSED INTL REALTY. Stellar MLS
- $350,0002 bd2 ba1.6k sqft2772 AUBURN BOULEVARD, PORT CHARLOTTE, FL 33948For Sale
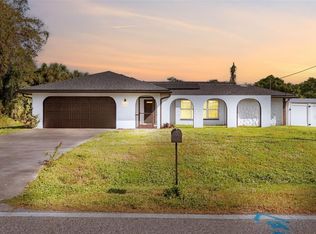 MLS ID #C7532930, Nick Demers, RE/MAX PALM REALTY. Stellar MLS
- $322,9003 bd2 ba1.7k sqft948 Andrews Ave, Port Charlotte, FL 33948For Sale By Owner

- $299,9003 bd2 ba1.4k sqft2626 Auburn Blvd, Pt Charlotte, FL 33948For Sale
 MLS ID #2026048037, Miki Matrullo, Home Matchmaking Realty LLC. Florida Gulf Coast MLS
- $396,0003 bd2 ba1.4k sqft820 DOLPHIN AVENUE NW, PORT CHARLOTTE, FL 33948For SaleMLS ID #C7533303, William Ransom, RE/MAX PALM REALTY. Stellar MLS
- $345,0003 bd2 ba2.1k sqft1109 AMPLE AVENUE, PORT CHARLOTTE, FL 33948For SaleMLS ID #C7523467, Tracy Hile, COLDWELL BANKER REALTY. Stellar MLS
- $374,9003 bd2 ba1.6k sqft2091 CANNOLOT BOULEVARD, PORT CHARLOTTE, FL 33948For SaleMLS ID #D6147304, Audrey Smith PA, KELLER WILLIAMS ISLAND LIFE REAL ESTATE. Stellar MLS
- $300,0002 bd2 ba1.3k sqft2074 WONDERWIN STREET, PORT CHARLOTTE, FL 33948For SaleMLS ID #C7533677, Craig Cirella, SUNBELT MANAGEMENT SERVICES. Stellar MLS
- $274,9903 bd2 ba1.6k sqft1000 GREAT FALLS AVE AVENUE, PORT CHARLOTTE, FL 33948For SaleMLS ID #C7533193, Brian Young, Jr, FIVE STAR REALTY OF CHARLOTTE. Stellar MLS
- $360,0003 bd2 ba1.7k sqft643 BLUE LANE NW, PORT CHARLOTTE, FL 33952For SaleMLS ID #C7533407, Priscilla Perez-McGuire, RE/MAX PALM REALTY. Stellar MLS
- $325,0003 bd2 ba1.7k sqft881 RIVIERA LANE NW, PORT CHARLOTTE, FL 33948For SaleMLS ID #C7525817, Christopher Grant, GRANT TEAM REAL ESTATE, LLC. Stellar MLS
- $325,0003 bd2 ba1.9k sqft2058 LAKE VIEW BOULEVARD, PORT CHARLOTTE, FL 33948For SaleMLS ID #C7529575, Christopher Grant, GRANT TEAM REAL ESTATE, LLC. Stellar MLS
- $360,0003 bd2 ba1.6k sqft2232 SUNNINGLOW STREET, PORT CHARLOTTE, FL 33948New ConstructionMLS ID #C7528899, Trish Lohela, HOLIDAY BUILDERS GULF COAST. Stellar MLS
- $345,0003 bd2 ba1.2k sqft17433 HARRIS AVENUE, PORT CHARLOTTE, FL 33948For SaleMLS ID #C7531688, Jesse DeMello, RE/MAX PALM REALTY. Stellar MLS
- $379,9993 bd2 ba1.6k sqft3349 ROCK CREEK DRIVE, PORT CHARLOTTE, FL 33948For SaleMLS ID #C7527631, Brian Helgemo, COMPASS FLORIDA. Stellar MLS
- $320,0003 bd2 ba1.6k sqft3501 CONMORE STREET, PORT CHARLOTTE, FL 33948For SaleMLS ID #C7529901, Christopher Grant, GRANT TEAM REAL ESTATE, LLC. Stellar MLS
- $290,0004 bd2 ba1.4k sqft1199 AMPLE AVENUE, PORT CHARLOTTE, FL 33948For SaleMLS ID #C7533629, Jesse DeMello, RE/MAX PALM REALTY. Stellar MLS
- $316,9003 bd2 ba1.3k sqft19163 BAOY AVENUE, PORT CHARLOTTE, FL 33948For SaleMLS ID #C7531104, Christopher Grant, GRANT TEAM REAL ESTATE, LLC. Stellar MLS
- $314,0004 bd2 ba1.6k sqft650 CHEVY CHASE STREET, PORT CHARLOTTE, FL 33948For SaleMLS ID #D6148290, Jan Fanstill, CENTURY 21 TROPICAL BREEZE. Stellar MLS
