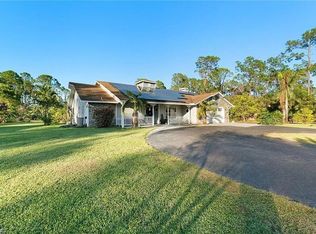
This is a 3723 square foot, single family home. This home is located at 2610 66th St SW, Naples, FL 34105.
Pre-foreclosure
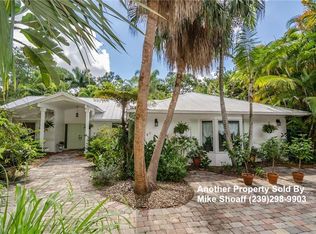
Street View
Est. $984,200
2610 66th St SW, Naples, FL 34105
--beds
--baths
3,723sqft
SingleFamily
Built in 1985
1.59 Acres Lot
$984,200 Zestimate®
$264/sqft
$-- HOA
Overview
- 193 days |
- 66 |
- 3 |
Facts & features
Interior
Interior area
- Total interior livable area: 3,723 sqft
Property
Parking
- Parking features: Garage - Attached
Features
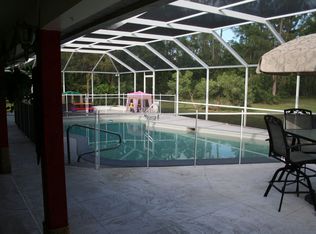
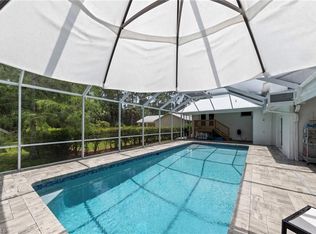
- Has spa: Yes
Lot
- Size: 1.59 Acres
Details
- Parcel number: 38107320008
Construction
Type & style
- Home type: SingleFamily
Condition
- Year built: 1985
Community & HOA
Location
- Region: Naples
Financial & listing details
- Price per square foot: $264/sqft
- Tax assessed value: $779,927
- Annual tax amount: $7,170
Visit our professional directory to find a foreclosure specialist in your area that can help with your home search.
Find a foreclosure agentForeclosure details
Estimated market value
$984,200
$837,000 - $1.14M
$8,972/mo
Price history
| Date | Event | Price |
|---|---|---|
| 1/10/2020 | Sold | $325,000+14%$87/sqft |
Source: Public Record Report a problem | ||
| 8/14/2000 | Sold | $285,000+9.6%$77/sqft |
Source: Public Record Report a problem | ||
| 8/26/1997 | Sold | $260,000$70/sqft |
Source: Public Record Report a problem | ||
Public tax history
| Year | Property taxes | Tax assessment |
|---|---|---|
| 2025 | $7,170 +7.2% | $697,877 +2.9% |
| 2024 | $6,689 +4.8% | $678,209 +3% |
| 2023 | $6,382 -3.4% | $658,455 +2.5% |
| 2022 | $6,608 +35.6% | $642,584 +50.5% |
| 2021 | $4,875 -0.8% | $426,943 +0.4% |
| 2020 | $4,915 +11.7% | $425,112 +10% |
| 2019 | $4,402 -9.4% | $386,465 -9.5% |
| 2018 | $4,857 -4.2% | $427,160 +5.6% |
| 2017 | $5,071 +0.9% | $404,658 +10% |
| 2016 | $5,026 +13.7% | $367,871 +3.1% |
| 2015 | $4,422 +1.6% | $356,780 +80.1% |
| 2014 | $4,353 +76.7% | $198,137 +1.9% |
| 2013 | $2,463 +0.9% | $194,470 +2.1% |
| 2012 | $2,440 -3.4% | $190,383 -4.2% |
| 2011 | $2,526 -13% | $198,629 -5.1% |
| 2010 | $2,902 +7.3% | $209,256 -10.5% |
| 2009 | $2,704 | $233,820 -17.5% |
| 2008 | $2,704 -10.7% | $283,536 +3% |
| 2007 | $3,029 -2.7% | $275,278 +2.5% |
| 2006 | $3,112 | $268,564 +3% |
| 2005 | $3,112 +2.5% | $260,742 +3% |
| 2004 | $3,037 -0.2% | $253,148 +1.9% |
| 2003 | $3,044 +1.4% | $248,428 +2.4% |
| 2002 | $3,003 -50.1% | $242,605 +1.6% |
| 2001 | $6,015 +113.6% | $238,784 |
| 2000 | $2,816 | -- |
Find assessor info on the county website
Monthly payment
Estimated monthly payment$1,822
All calculations are estimates and provided by Zillow, Inc. for informational purposes only. Actual amounts may vary.
HOA fees may include property taxes on listings classified as Co-Ops. Contact the listing agent and/or owner for fee details.
Mortgage interest rates are dependent on a number of factors, including credit score, down payment, and repayment length. Interest rate data provided by Zillow Group Marketplace, Inc. as of 1/1/1970 from various mortgage lenders with which we have lead or other similar arrangements; the Estimated Payment is an average of those rates.
See how much you could borrow to make a competitive offer.
Climate risks
Neighborhood: Golden Gate
Nearby schools
GreatSchools rating
- 8/10Poinciana Elementary SchoolGrades: PK-5Distance: 1.8 mi
- 9/10Gulfview Middle SchoolGrades: 6-8Distance: 4.4 mi
- 6/10Naples High SchoolGrades: PK,9-12Distance: 3.4 mi


- Florida
- Collier County
- Naples
- 34105
- Golden Gate
- 2610 66th St SW
Nearby cities
Nearby neighborhoods
Nearby zip codes
Other Naples Topics
