Great opportunity in the highly desirable Longfellow neighborhood! This up/down duplex features almost all new windows, a brand-new furnace for the upper unit, new electrical panels, separate utilities, and a huge fenced-in corner lot. Each unit offers 2 bedrooms and 1 full bath, with potential for an additional legal bedroom upstairs with the addition of a window. Additional space downstairs offers even more flexibility. Trampoline can stay with property. Great opportunity for an owner-occupant or investor!
Active
$384,900
2745 29th Ave S, Minneapolis, MN 55406
4beds
2baths
2,070sqft
Duplex Up and Down
Built in 1900
-- sqft lot
$-- Zestimate®
$186/sqft
$-- HOA
What's special
- 45 days
- 242
- 16
Zillow last checked:
Listing updated:
Listed by:
Tenzin Sopa 763-267-5574,
Real Broker, LLC
Source: NorthstarMLS as distributed by MLS GRID,MLS#: 7153629
Facts & features
Interior
Bedrooms & bathrooms
- Bedrooms: 4
- Bathrooms: 2
Heating
- Forced Air
Features
- Basement: Full,Unfinished
Interior area
- Total structure area: 2,790
- Total interior livable area: 2,070 sqft
- Finished area above ground: 2,070
- Finished area below ground: 0
Property
Accessibility
- Accessibility features: None
Features
- Levels: Two
- Pool features: None
- Fencing: None
Lot
- Size: 7,405 Square Feet
- Dimensions: 157 x 48
- Features: Corner Lot
Details
- Foundation area: 810
- Parcel number: 3602924410072
Construction
Type & style
- Home type: MultiFamily
- Property subtype: Duplex Up and Down
Materials
- Roof: Age 8 Years or Less
Condition
- New construction: No
- Year built: 1900
Utilities & green energy
- Electric: Circuit Breakers, 100 Amp Service, Power Company: Xcel Energy
- Gas: Natural Gas
- Sewer: City Sewer/Connected
- Water: City Water/Connected
Community & HOA
Community
- Subdivision: South Side Add
Location
- Region: Minneapolis
Financial & listing details
- Price per square foot: $186/sqft
- Tax assessed value: $265,800
- Annual tax amount: $6,257
- Date on market: 10/2/2026
- Road surface type: Paved
Estimated market value
Not available
Estimated sales range
Not available
Not available
Price history
| Date | Event | Price |
|---|---|---|
| 10/3/2026 | Listed for sale | $384,900+28.3%$186/sqft |
Source:  NorthstarMLS as distributed by MLS GRID #7153629 Report a problem | ||
| 7/23/2024 | Sold | $300,000+0%$145/sqft |
Source: NorthstarMLS as distributed by MLS GRID #6530633 Report a problem | ||
| 6/18/2024 | Pending sale | $299,999$145/sqft |
Source: NorthstarMLS as distributed by MLS GRID #6530633 Report a problem | ||
| 6/12/2024 | Listed for sale | $299,999$145/sqft |
Source: NorthstarMLS as distributed by MLS GRID #6530633 Report a problem | ||
| 6/12/2024 | Pending sale | $299,999$145/sqft |
Source: NorthstarMLS as distributed by MLS GRID #6530633 Report a problem | ||
| 5/21/2024 | Listed for sale | $299,999+20%$145/sqft |
Source: NorthstarMLS as distributed by MLS GRID #6530633 Report a problem | ||
| 8/30/2022 | Sold | $250,000$121/sqft |
Source: NorthstarMLS as distributed by MLS GRID #6159994 Report a problem | ||
| 6/23/2022 | Pending sale | $250,000$121/sqft |
Source: NorthstarMLS as distributed by MLS GRID #6159994 Report a problem | ||
| 6/16/2022 | Listed for sale | $250,000+233.3%$121/sqft |
Source: NorthstarMLS as distributed by MLS GRID #6159994 Report a problem | ||
| 10/5/1998 | Sold | $75,000$36/sqft |
Source: Public Record Report a problem | ||
Public tax history
| Year | Property taxes | Tax assessment |
|---|---|---|
| 2026 | $6,257 +64.1% | $265,800 -4.4% |
| 2025 | $3,813 +8.5% | $277,900 +0.7% |
| 2024 | $3,514 -6.4% | $276,000 -1.4% |
| 2023 | $3,755 -25.3% | $280,000 -5.1% |
| 2022 | $5,026 +39.3% | $295,000 +13.9% |
| 2021 | $3,608 -7.4% | $259,000 +0.8% |
| 2020 | $3,896 +8% | $257,000 |
| 2019 | $3,608 -7.4% | $257,000 +10.1% |
| 2018 | $3,896 +26.8% | $233,500 +20.1% |
| 2017 | $3,072 +12.5% | $194,500 +3.5% |
| 2016 | $2,731 +0.7% | $188,000 +7.4% |
| 2015 | $2,711 -11% | $175,000 +12.5% |
| 2014 | $3,045 +10.7% | $155,500 +5.1% |
| 2013 | $2,752 -13.9% | $148,000 -14.7% |
| 2012 | $3,196 -9% | $173,500 -9.6% |
| 2011 | $3,512 +6% | $192,000 -6.1% |
| 2010 | $3,314 -1.6% | $204,500 |
| 2009 | $3,368 +31.8% | $204,500 +32% |
| 2006 | $2,555 +55.9% | $154,900 +22.4% |
| 2005 | $1,639 +13.5% | $126,600 +18.3% |
| 2004 | $1,444 +14.8% | $107,000 +12.8% |
| 2002 | $1,258 -50.2% | $94,900 |
| 2001 | $2,523 | -- |
Find assessor info on the county website
Monthly payment
Est. payment
Payment breakdown
Explore the cost of this home by adjusting the details. Changes won't be saved.Climate risks
Neighborhood: Longfellow


Similar homes
- $380,0004 bd2 ba1.8k sqft3047 Grand St NE, Minneapolis, MN 55418For Sale
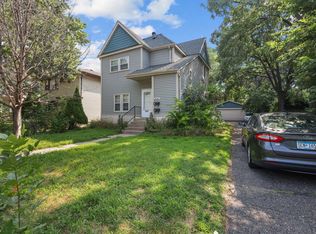
 MLS ID #7173303, Jacqueline Howard, Banneker Realty, LLC. NorthstarMLS as distributed by MLS GRID
- $389,9007 bd3 ba2.5k sqft3605 3rd Ave S, Minneapolis, MN 55409For Sale
 MLS ID #7074993, David H Berglund, Summit Realty LLC. NorthstarMLS as distributed by MLS GRID
- $375,0004 bd2 ba1.5k sqft3127 Silver Lake Rd NE, Minneapolis, MN 55418For Sale
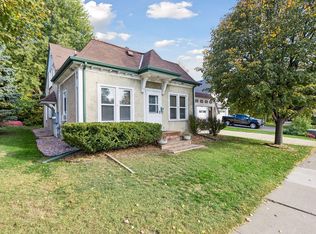 MLS ID #7162170, Jason J Reed, RE/MAX Results. NorthstarMLS as distributed by MLS GRID
- $415,0004 bd2 ba2.2k sqft921 Weeks Ave SE, Minneapolis, MN 55414For Sale
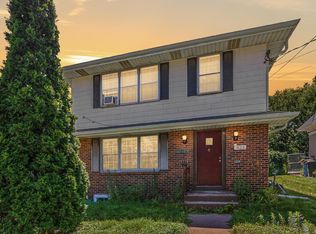 MLS ID #7098486, Corey Brenner, eXp Realty. NorthstarMLS as distributed by MLS GRID
- $375,0004 bd2 ba1.7k sqft806 Como Ave, Saint Paul, MN 55103For SaleMLS ID #7168780, Jason J Reed, RE/MAX Results. NorthstarMLS as distributed by MLS GRID
- $405,0004 bd2 ba2.1k sqft1062 Front Ave, Saint Paul, MN 55103For SaleMLS ID #7125982, Michael J Vanderheyden, RE/MAX Results. NorthstarMLS as distributed by MLS GRID
- $425,0004 bd2 ba1.9k sqft639 Adams St NE, Minneapolis, MN 55413For SaleMLS ID #7160940, Kim Wetteland, Edina Realty, Inc.. NorthstarMLS as distributed by MLS GRID
- $349,9005 bd3 ba2k sqft1109 23rd Ave SE, Minneapolis, MN 55414For SaleMLS ID #7166276, Laurie M Allen, Coldwell Banker Realty - Lakes. NorthstarMLS as distributed by MLS GRID
- $385,0004 bd2 ba1.8k sqft7033 18th Ave S, Richfield, MN 55423For SaleMLS ID #7166846, Stephanie Checkley, Keller Williams Premier Realty. NorthstarMLS as distributed by MLS GRID
- $320,0003 bd2 ba1.8k sqft3905 Cedar Ave S, Minneapolis, MN 55407For SaleMLS ID #7169616, Janette Liddle, Keller Williams Classic Realty. NorthstarMLS as distributed by MLS GRID
- $419,0004 bd3 ba1.9k sqft1273 Juno Ave, Saint Paul, MN 55116For SaleMLS ID #7169950, Han Zhong, Keller Williams Classic Realty. NorthstarMLS as distributed by MLS GRID
- $419,9005 bd2 ba2.3k sqft2619 Hayes St NE, Minneapolis, MN 55418For SaleMLS ID #7153487, Bryan M Cox, True Neighbor Realty. NorthstarMLS as distributed by MLS GRID
- $369,9005 bd2 ba2k sqft1231 Hewitt Ave, Saint Paul, MN 55104For SaleMLS ID #7104434, Bridgette L Prew, Redfin Corporation. NorthstarMLS as distributed by MLS GRID
- $375,0004 bd2 ba2k sqft9043 13th Ave S, Bloomington, MN 55425For SaleMLS ID #7112677, Tim Gilbertson, Edina Realty, Inc.. NorthstarMLS as distributed by MLS GRID
- $389,0004 bd3 ba2.1k sqft8236 Queen Ave S, Bloomington, MN 55431For SaleMLS ID #7118767, Joshua Robert Anschutz, Pemberton RE. NorthstarMLS as distributed by MLS GRID
- $379,9005 bd2 ba1.8k sqft2726 Dellwood St, Roseville, MN 55113For SaleMLS ID #7135469, Bridgette L Prew, Redfin Corporation. NorthstarMLS as distributed by MLS GRID
- $470,0004 bd2 ba2.5k sqft4048 17th Ave S, Minneapolis, MN 55407For SaleMLS ID #7109112, MacGregor Smith, eXp Realty. NorthstarMLS as distributed by MLS GRID
- $450,0004 bd2 ba2.3k sqft657 Delaware Ave, Saint Paul, MN 55107For SaleMLS ID #7169680, Michael R. Distad, Coldwell Banker Realty. NorthstarMLS as distributed by MLS GRID
- $429,9004 bd2 ba2.2k sqft848 Sandhurst Dr W, Roseville, MN 55113For SaleMLS ID #7167235, Brett Gronquist, TheMLSonline.com, Inc.. NorthstarMLS as distributed by MLS GRID
- $375,0004 bd2 ba1.6k sqft1913 Independence Ave N, Golden Valley, MN 55427For SaleMLS ID #7156098, Alex Murray, Engel & Volkers Blaine. NorthstarMLS as distributed by MLS GRID
