$555,000
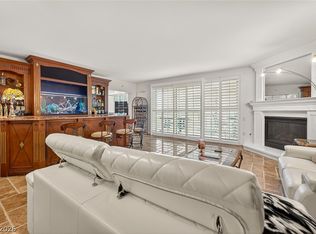
2 bd|2 ba|1.5k sqft
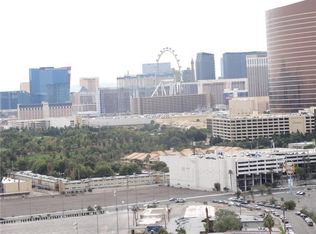
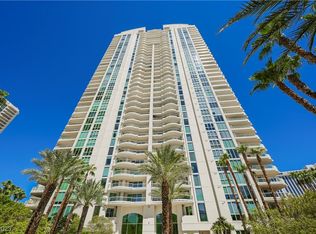
2877 Paradise Rd UNIT 905, Las Vegas, NV 89109
Sold
Zillow last checked:
Listing updated:
Tamra J. Trainer BS.0035530 (702)858-1777,
Platinum Real Estate Prof
Not available
Estimated sales range
Not available
Not available
| Date | Event | Price |
|---|---|---|
| 6/22/2026 | Listed for sale | $1,039,000$370/sqft |
Source: | ||
| 3/22/2026 | Listing removed | $1,039,000$370/sqft |
Source: | ||
| 10/3/2025 | Price change | $1,039,000-2.9%$370/sqft |
Source: | ||
| 10/28/2024 | Price change | $1,070,000+10.5%$381/sqft |
Source: | ||
| 5/7/2024 | Listed for sale | $968,000+7.6%$345/sqft |
Source: | ||
| 4/23/2021 | Sold | $900,000-7%$321/sqft |
Source: | ||
| 4/13/2021 | Pending sale | $968,000$345/sqft |
Source: | ||
| 2/12/2021 | Listed for sale | $968,000$345/sqft |
Source: | ||
| 2/5/2021 | Pending sale | $968,000$345/sqft |
Source: | ||
| 1/28/2021 | Listed for sale | $968,000+13.9%$345/sqft |
Source: | ||
| 6/20/2018 | Sold | $850,000-5%$303/sqft |
Source: | ||
| 6/14/2018 | Pending sale | $895,000$319/sqft |
Source: Award Realty #2001635 Report a problem | ||
| 6/13/2018 | Listed for sale | $895,000+105.3%$319/sqft |
Source: Award Realty #2001635 Report a problem | ||
| 1/23/2014 | Sold | $435,981+2%$155/sqft |
Source: Public Record Report a problem | ||
| 11/15/2011 | Sold | $427,500+26.1%$152/sqft |
Source: Public Record Report a problem | ||
| 9/28/2011 | Listed for sale | $339,000-53.9%$121/sqft |
Source: RE/MAX Executives #1188917 Report a problem | ||
| 5/27/2011 | Sold | $734,575-11%$262/sqft |
Source: Public Record Report a problem | ||
| 8/14/2003 | Sold | $825,000$294/sqft |
Source: Public Record Report a problem | ||
| Year | Property taxes | Tax assessment |
|---|---|---|
| 2025 | $5,905 +3% | $307,387 -1.4% |
| 2024 | $5,734 +3% | $311,598 +16.2% |
| 2023 | $5,567 +3% | $268,212 +18.4% |
| 2022 | $5,405 +3% | $226,547 +4.8% |
| 2021 | $5,247 +6.7% | $216,088 +11.6% |
| 2020 | $4,917 +4.8% | $193,612 -6.7% |
| 2019 | $4,692 +6.9% | $207,599 |
| 2018 | $4,389 | $207,599 -16.1% |
| 2017 | $4,389 | $247,489 +31.9% |
| 2016 | $4,389 +3.4% | $187,691 +4.5% |
| 2015 | $4,246 | $179,592 +28.1% |
| 2014 | $4,246 | $140,158 |
| 2013 | -- | $140,158 -16.4% |
| 2012 | -- | $167,616 -15.3% |
| 2011 | -- | $197,926 +9.1% |
| 2010 | -- | $181,487 -37.5% |
| 2009 | -- | $290,222 |
| 2008 | -- | $290,222 -12.2% |
| 2007 | -- | $330,642 +2.6% |
| 2006 | -- | $322,237 +16.7% |
| 2005 | -- | $276,094 +3.7% |
| 2004 | -- | $266,263 +5.1% |
| 2003 | -- | $253,250 -1.4% |
| 2002 | -- | $256,930 |
Find assessor info on the county website
Source: LVR. This data may not be complete. We recommend contacting the local school district to confirm school assignments for this home.
A local agent can set up tours, give advice and negotiate with sellers.