$303,200
2 bd|1 ba|976 sqft
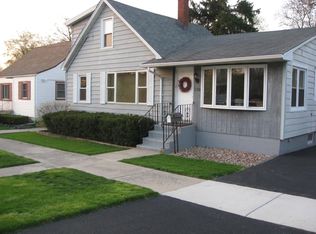
304 Freehauf St, Lemont, IL 60439
Off Market
Zillow last checked:
Listing updated:
Jim Keorpes 708-320-0002,
HomeSmart Realty Group
Not available
Estimated sales range
Not available
Not available
| Date | Event | Price |
|---|---|---|
| 6/25/2026 | Price change | $383,8490%$386/sqft |
Source: MRED as distributed by MLS GRID #12661500 Report a problem | ||
| 6/18/2026 | Price change | $383,8990%$386/sqft |
Source: | ||
| 6/11/2026 | Price change | $383,999-0.1%$386/sqft |
Source: | ||
| 6/5/2026 | Price change | $384,499-0.1%$387/sqft |
Source: | ||
| 5/29/2026 | Listed for sale | $384,999-0.8%$387/sqft |
Source: | ||
| 5/19/2026 | Listing removed | $387,950$390/sqft |
Source: | ||
| 5/14/2026 | Price change | $387,9500%$390/sqft |
Source: | ||
| 5/6/2026 | Price change | $388,000-0.2%$390/sqft |
Source: | ||
| 4/24/2026 | Price change | $388,9000%$391/sqft |
Source: | ||
| 4/16/2026 | Price change | $389,000-2.5%$391/sqft |
Source: | ||
| 4/2/2026 | Listed for sale | $399,000+2.6%$401/sqft |
Source: | ||
| 3/28/2026 | Contingent | $389,000$391/sqft |
Source: | ||
| 3/28/2026 | Listed for sale | $389,000$391/sqft |
Source: | ||
| 3/27/2026 | Contingent | $389,000$391/sqft |
Source: | ||
| 3/22/2026 | Listed for sale | $389,000+548.3%$391/sqft |
Source: | ||
| 4/17/2019 | Sold | $60,000$60/sqft |
Source: Public Record Report a problem | ||
| Year | Property taxes | Tax assessment |
|---|---|---|
| 2024 | -- | $23,000 |
| 2023 | $4,091 +24.3% | $23,000 +35.5% |
| 2022 | $3,291 +2.5% | $16,977 |
| 2021 | $3,212 -20.5% | $16,977 |
| 2020 | $4,038 +12.3% | $16,977 -10.5% |
| 2019 | $3,594 -16.7% | $18,968 |
| 2018 | $4,315 +49.4% | $18,968 |
| 2017 | $2,889 +7.8% | $18,968 +16% |
| 2016 | $2,680 +0.8% | $16,345 |
| 2015 | $2,660 -1.9% | $16,345 |
| 2014 | $2,711 -14.2% | $16,345 -11.2% |
| 2013 | $3,160 +1.5% | $18,407 |
| 2012 | $3,114 -1.6% | $18,407 |
| 2011 | $3,166 +8.8% | $18,407 -16.2% |
| 2010 | $2,909 +16.1% | $21,974 |
| 2009 | $2,506 +13.8% | $21,974 -5% |
| 2008 | $2,202 -9.5% | $23,131 +14.9% |
| 2007 | $2,435 +5.8% | $20,134 |
| 2006 | $2,302 +8.6% | $20,134 |
| 2005 | $2,119 -6.1% | $20,134 +38.2% |
| 2004 | $2,255 +8.5% | $14,569 |
| 2003 | $2,078 +84.5% | $14,569 |
| 2002 | $1,126 -17.6% | $14,569 +15.5% |
| 2001 | $1,366 +1.6% | $12,619 |
| 2000 | $1,345 +0% | $12,619 |
| 1999 | $1,345 | $12,619 |
Find assessor info on the county website
Source: MRED as distributed by MLS GRID. This data may not be complete. We recommend contacting the local school district to confirm school assignments for this home.
A local agent can set up tours, give advice and negotiate with sellers.