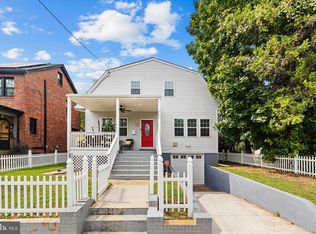
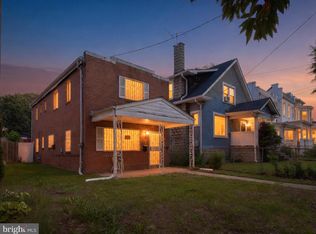
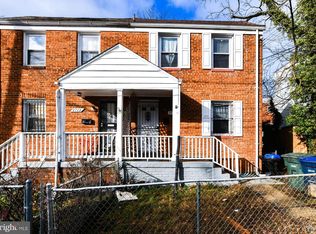
This 1873 square foot single family home has 3 bedrooms and 2.0 bathrooms. This home is located at 3335 5th St SE, Washington, DC 20032.
Foreclosed
Est. $398,200
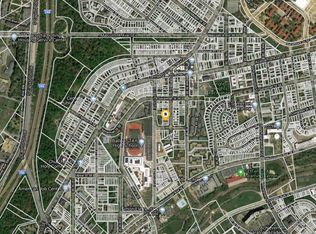
3335 5th St SE, Washington, DC 20032
3beds
2baths
1,873sqft
SingleFamily
Built in 1907
2,659 Square Feet Lot
$-- Zestimate®
$213/sqft
$115/mo HOA
Overview
- 230 days |
- 18 |
- 0 |
Facts & features
Interior
Bedrooms & bathrooms
- Bedrooms: 3
- Bathrooms: 2
Heating
- Other, Other
Cooling
- None
Features
- Flooring: Hardwood
Interior area
- Total interior livable area: 1,873 sqft
Property
Features
- Exterior features: Stucco
Lot
- Size: 2,659 Square Feet
Details
- Parcel number: 59710039
Construction
Type & style
- Home type: SingleFamily
Materials
- Roof: Composition
Condition
- Year built: 1907
Community & HOA
HOA
- Has HOA: Yes
- HOA fee: $115 monthly
Location
- Region: Washington
Financial & listing details
- Price per square foot: $213/sqft
- Tax assessed value: $398,200
- Annual tax amount: $3,335
Visit our professional directory to find a foreclosure specialist in your area that can help with your home search.
Find a foreclosure agentForeclosure details
Estimated market value
Not available
Estimated sales range
Not available
$3,250/mo
Price history
| Date | Event | Price |
|---|---|---|
| 11/12/2025 | Sold | $268,191+34.8%$143/sqft |
Source: Public Record Report a problem | ||
| 9/24/2024 | Listing removed | $199,000$106/sqft |
Source: | ||
| 7/17/2024 | Pending sale | $199,000$106/sqft |
Source: | ||
| 7/10/2023 | Contingent | $199,000$106/sqft |
Source: | ||
| 7/2/2023 | Listed for sale | $199,000-24.2%$106/sqft |
Source: | ||
| 5/2/2023 | Listing removed | $262,500$140/sqft |
Source: | ||
| 3/22/2023 | Contingent | $262,500$140/sqft |
Source: | ||
| 3/21/2023 | Listed for sale | $262,500+5%$140/sqft |
Source: | ||
| 3/12/2023 | Contingent | $250,000$133/sqft |
Source: | ||
| 3/12/2023 | Pending sale | $250,000$133/sqft |
Source: | ||
| 3/10/2023 | Price change | $250,000-4.8%$133/sqft |
Source: | ||
| 3/2/2023 | Listed for sale | $262,500-12.2%$140/sqft |
Source: | ||
| 2/24/2023 | Contingent | $299,000$160/sqft |
Source: | ||
| 2/15/2023 | Price change | $299,000-2%$160/sqft |
Source: | ||
| 1/14/2022 | Pending sale | $305,000$163/sqft |
Source: | ||
| 1/12/2022 | Listed for sale | $305,000-10%$163/sqft |
Source: | ||
| 1/10/2022 | Contingent | $339,000$181/sqft |
Source: | ||
| 1/5/2022 | Listed for sale | $339,000$181/sqft |
Source: | ||
Public tax history
| Year | Property taxes | Tax assessment |
|---|---|---|
| 2025 | $3,335 +3.4% | $392,400 +3.4% |
| 2024 | $3,226 +3.6% | $379,530 +3.6% |
| 2023 | $3,115 +10.5% | $366,510 +10.5% |
| 2022 | $2,819 +6.2% | $331,670 +6.2% |
| 2021 | $2,654 +3.3% | $312,270 +3.3% |
| 2020 | $2,570 +3.9% | $302,370 +3.9% |
| 2018 | $2,473 +0.4% | $290,940 +0.4% |
| 2017 | $2,464 +21.7% | $289,910 +21.7% |
| 2016 | $2,024 +14% | $238,170 +14% |
| 2015 | $1,776 +6.3% | $208,910 +6.3% |
| 2014 | $1,671 -2.3% | $196,570 -2.3% |
| 2013 | $1,710 -5.6% | $201,180 -5.6% |
| 2012 | $1,812 | $213,130 |
| 2011 | $1,812 -21.6% | $213,130 -21.6% |
| 2010 | $2,309 -6% | $271,700 -6% |
| 2009 | $2,457 +53.5% | $289,060 +59% |
| 2007 | $1,600 +35.3% | $181,840 +41.4% |
| 2006 | $1,183 +3.4% | $128,580 +7.9% |
| 2005 | $1,144 +2.4% | $119,130 +2.4% |
| 2004 | $1,117 +36.6% | $116,330 +36.6% |
| 2003 | $817 +6% | $85,130 +6% |
| 2002 | $771 -17.4% | $80,307 -1.1% |
| 2001 | $934 | $81,200 |
Find assessor info on the county website
Monthly payment
Estimated monthly payment$1,822
All calculations are estimates and provided by Zillow, Inc. for informational purposes only. Actual amounts may vary.
HOA fees may include property taxes on listings classified as Co-Ops. Contact the listing agent and/or owner for fee details.
Mortgage interest rates are dependent on a number of factors, including credit score, down payment, and repayment length. Interest rate data provided by Zillow Group Marketplace, Inc. as of 1/1/1970 from various mortgage lenders with which we have lead or other similar arrangements; the Estimated Payment is an average of those rates.
See how much you could borrow to make a competitive offer.
Climate risks
Neighborhood: Congress Heights
Nearby schools
GreatSchools rating
- 3/10King Elementary SchoolGrades: PK-5Distance: 0.2 mi
- 4/10Hart Middle SchoolGrades: 6-8Distance: 0.3 mi
- 3/10Ballou High SchoolGrades: 9-12Distance: 0.2 mi


Nearby cities
Nearby neighborhoods
Nearby zip codes
Other Washington Topics
