Skip main navigation
Active
  • $174,900

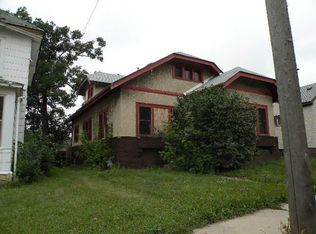
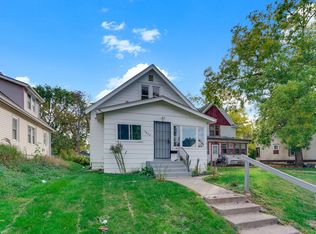
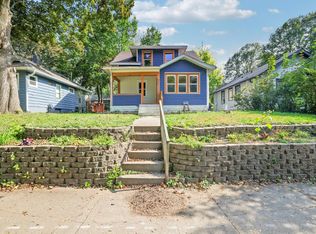
    3455 Fremont Ave N, Minneapolis, MN 55412

    4beds
    2,166sqft
    : 
    $1,243/mo
    Get pre-qualified
    Single Family
    Built in 1923
    5,227 Square Feet Lot
    $174,700 Zestimate®
    $81/sqft
    $-- HOA

    What's special

    21 days
    598
    24

    Likely to sell faster than

    Zillow last checked:

    Listing updated:

    Listed by:

    Ronal Bustamante Ortega 612-247-1839,

    RE/MAX Results

    Source: NorthstarMLS as distributed by MLS GRID,MLS#: 7165982MLS Logo

      Facts & features

      Interior

      Bedrooms & bathrooms
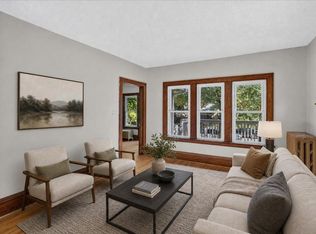
      • Bedrooms: 4
      • Bathrooms: 2
      • Full bathrooms: 2
      Heating
      • Forced Air
      Cooling
      • Central Air
      Features
      • Basement: Partial
      • Number of fireplaces: 1
      Interior area
      • Total structure area: 2,210
      • Total interior livable area: 2,166 sqft
      • Finished area above ground: 1,282
      • Finished area below ground: 884

      Property

      Parking
      • Total spaces: 2
      • Parking features: Detached Garage
      • Has garage: Yes
      • Carport spaces: 2
      Accessibility
      • Accessibility features: None
      Features
      • Levels: One
      • Stories: 1
      Lot
      • Size: 5,227 Square Feet
      • Dimensions: 40 x 126
      • Features: Tree Coverage - Light
      Details
      • Foundation area: 1016
      • Parcel number: 0902924120091
      • Zoning description: Residential-Single Family

      Construction

      Type & style
      • Home type: SingleFamily
      • Property subtype: Single Family
      Materials
      • Roof: Asphalt
      Condition
      • New construction: No
      • Year built: 1923

      Utilities & green energy

      • Gas: Natural Gas
      • Sewer: City Sewer/Connected
      • Water: City Water/Connected

      Community & HOA

      Community
      • Subdivision: Dean Park
      HOA
      • Has HOA: No
      Location
      • Region: Minneapolis

      Financial & listing details

      • Price per square foot: $81/sqft
      • Tax assessed value: $70,100
      • Annual tax amount: $1,053
      • Date on market: 10/29/2026
      • Cumulative days on market: 20 days

        Estimated market value

        $174,700

        $166,000 - $183,000

        $2,807/mo

        Price history

        DateEventPrice
        10/29/2026Listed for sale$174,900-30%$81/sqft
        Source: NorthstarMLS as distributed by MLS GRID #7165982 Report a problem
        7/2/2025Listing removed$250,000$115/sqft
        Source: NorthstarMLS as distributed by MLS GRID #6714961 Report a problem
        5/5/2025Listed for sale$250,000+76.7%$115/sqft
        Source: NorthstarMLS as distributed by MLS GRID #6714961 Report a problem
        3/20/2018Listing removed$141,500$65/sqft
        Source: The Agency Real Estate Brokerage Inc #4913830 Report a problem
        3/7/2018Listed for sale$141,500+66.5%$65/sqft
        Source: The Agency Real Estate Brokerage Inc #4913830 Report a problem
        10/2/2014Listing removed$85,000$39/sqft
        Source: RES Realty #4526003 Report a problem
        9/10/2014Listed for sale$85,000+448.4%$39/sqft
        Source: RES Realty #4526003 Report a problem
        3/23/2009Sold$15,500-48.2%$7/sqft
        Source: Lake Superior Area Realtors as distributed by MLS GRID #1007222 Report a problem
        12/11/2008Listing removed$29,900$14/sqft
        Source: foreclosure.com Report a problem
        11/5/2008Price change$29,900-5.1%$14/sqft
        Source: foreclosure.com Report a problem
        9/27/2008Price change$31,500$15/sqft
        Source: foreclosure.com Report a problem
        8/25/2008Listed for sale--
        Source: foreclosure.com Report a problem

        Public tax history

        YearProperty taxesTax assessment
        2026$24,343 +56.8%$70,100 +3.1%
        2025$15,526 +237.5%$68,000 +9.7%
        2024$4,600 +115.3%$62,000 -58.9%
        2023$2,136 -40.6%$151,000 +4.9%
        2022$3,596 +153.5%$144,000 +41.2%
        2021$1,418 -63.8%$102,000 +15.3%
        2020$3,917 +176.2%$88,500
        2019$1,418 -63.8%$88,500 +4.7%
        2018$3,917 +199.8%$84,500 +19%
        2017$1,307 -58.4%$71,000 +6%
        2016$3,143 +93.7%$67,000 +14.5%
        2015$1,623 -20.7%$58,500
        2014$2,047 +10.6%$58,500
        2013$1,850 +13.3%$58,500 -10%
        2012$1,632 -7.7%$65,000
        2011$1,769 +18.6%$65,000 -27%
        2010$1,492 -18.2%$89,000
        2009$1,823 +91.4%$89,000 +1.7%
        2006$952 +13.9%$87,500 +15%
        2005$836 +4.6%$76,100 +15%
        2004$799 +10.4%$66,200 +12.2%
        2002$724 -52.5%$59,000
        2001$1,526 --
        Find assessor info on the county website

        Monthly payment

        Est. payment

        Payment breakdown

        Explore the cost of this home by adjusting the details. Changes won't be saved.
        All calculations are estimates and provided by Zillow, Inc. for informational purposes only. Actual amounts may vary.
        HOA fees may include property taxes on listings classified as Co-Ops. Contact the listing agent and/or owner for fee details.
        See how much you could borrow to make a competitive offer.

        Climate risks

        Neighborhood: Folwell

        Getting around

        59 / 100
        Somewhat Walkable
        50 / 100
        Good Transit
        58 / 100
        Bikeable

        Nearby schools

        GreatSchools rating

        A local agent can set up tours, give advice and negotiate with sellers.
        Browse local experts