$220,000
4 bd|2 ba|2.3k sqft
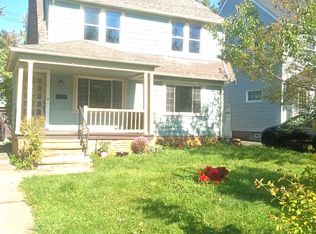
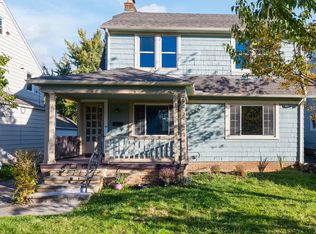
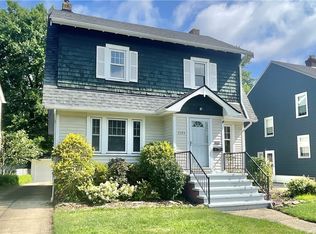
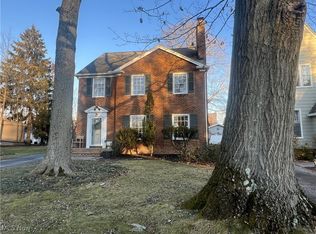
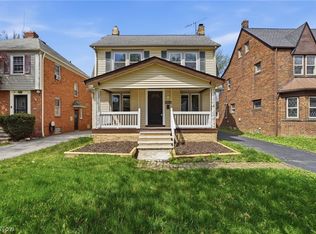
3569 Silsby Rd, University Heights, OH 44118
Sold
Zillow last checked:
Listing updated:
Benjamin Swiecicki 330-414-2264 bswiecicki@stoufferrealty.com,
Berkshire Hathaway HomeServices Stouffer Realty
Not available
Estimated sales range
Not available
Not available
| Date | Event | Price |
|---|---|---|
| 3/25/2024 | Sold | $365,000-3.2% |
Source: MLS Now #4494454 Report a problem | ||
| 3/7/2024 | Contingent | $377,000 |
Source: MLS Now #4494454 Report a problem | ||
| 2/28/2024 | Price change | $377,000-0.5% |
Source: MLS Now #4494454 Report a problem | ||
| 1/30/2024 | Price change | $379,000-2.1% |
Source: MLS Now #4494454 Report a problem | ||
| 1/16/2024 | Price change | $387,000-0.5% |
Source: MLS Now #4494454 Report a problem | ||
| 1/2/2024 | Price change | $389,000-2% |
Source: MLS Now #4494454 Report a problem | ||
| 12/27/2023 | Listed for sale | $397,000 |
Source: MLS Now #4494454 Report a problem | ||
| 12/5/2023 | Pending sale | $397,000 |
Source: MLS Now #4494454 Report a problem | ||
| 11/13/2023 | Price change | $397,000-0.5% |
Source: MLS Now #4494454 Report a problem | ||
| 10/13/2023 | Price change | $399,000-4.8% |
Source: MLS Now #4494454 Report a problem | ||
| 10/5/2023 | Listed for sale | $419,000+291.6% |
Source: MLS Now #4494454 Report a problem | ||
| 6/1/2021 | Sold | $107,000+40.2% |
Source: | ||
| 2/8/2021 | Sold | $76,300-42.6% |
Source: Public Record Report a problem | ||
| 5/26/2004 | Sold | $133,000+77.3% |
Source: Public Record Report a problem | ||
| 8/8/2003 | Sold | $75,000 |
Source: Public Record Report a problem | ||
| Year | Property taxes | Tax assessment |
|---|---|---|
| 2024 | $5,071 +27.5% | $59,050 +62.9% |
| 2023 | $3,979 +0.5% | $36,260 |
| 2022 | $3,959 +2% | $36,260 |
| 2021 | $3,881 +1.3% | $36,260 +12% |
| 2020 | $3,830 +5.8% | $32,380 |
| 2019 | $3,620 -3.8% | $32,380 |
| 2018 | $3,761 -51.3% | $32,380 -9.1% |
| 2017 | $7,721 0% | $35,640 |
| 2016 | $7,723 +7.2% | $35,640 |
| 2015 | $7,206 +37.7% | $35,640 +2% |
| 2014 | $5,231 +15.1% | $34,930 |
| 2013 | $4,545 +68.5% | $34,930 |
| 2012 | $2,698 -37.3% | $34,930 -5% |
| 2011 | $4,304 +64.1% | $36,750 |
| 2010 | $2,623 -55.8% | $36,750 |
| 2009 | $5,928 +99.7% | $36,750 -10% |
| 2008 | $2,969 +7.4% | $40,850 |
| 2007 | $2,765 -16.4% | $40,850 |
| 2006 | $3,308 +5.9% | $40,850 +13.5% |
| 2005 | $3,124 +1.2% | $35,980 |
| 2004 | $3,086 +15.1% | $35,980 |
| 2003 | $2,681 +3.4% | $35,980 +8.8% |
| 2002 | $2,592 -49.9% | $33,080 |
| 2001 | $5,174 +0.4% | $33,080 |
| 2000 | $5,151 | $33,080 |
Find assessor info on the county website
Source: MLS Now. This data may not be complete. We recommend contacting the local school district to confirm school assignments for this home.
A local agent can set up tours, give advice and negotiate with sellers.