Beautiful home with many upgrades in a growing neighborhood in Bellwood. New Kitchen with new cabinets and granite countertops, New Kitchen Appliances - Range, Microwave, Stove, and Fridge. Newly wired electrical with new smoke detectors and carbon monoxide. Partially finished basement. Large Back Yard and Central Air. 1 year home warranty included.
Active
$269,000
3822 Congress St, Bellwood, IL 60104
2beds
920sqft
Single Family Residence
Built in 1947
4,726 Square Feet Lot
$267,300 Zestimate®
$292/sqft
$-- HOA
What's special
Partially finished basementNewly wired electricalCentral air
- 6 days
- 192
- 12
Zillow last checked:
Listing updated:
Listed by:
Joshua Chou 847-962-8268,
Kale Realty
Source: MRED as distributed by MLS GRID,MLS#: 12801136
Facts & features
Interior
Bedrooms & bathrooms
- Bedrooms: 2
- Bathrooms: 2
- Full bathrooms: 2
Rooms
- Room types: No additional rooms
Primary bedroom
- Level: Main
- Area: 132 Square Feet
- Dimensions: 12X11
Bedroom 2
- Level: Second
- Area: 120 Square Feet
- Dimensions: 12X10
Dining room
- Level: Main
- Area: 90 Square Feet
- Dimensions: 10X9
Family room
- Level: Main
- Area: 180 Square Feet
- Dimensions: 12X15
Kitchen
- Level: Main
- Area: 80 Square Feet
- Dimensions: 8X10
Living room
- Level: Main
- Area: 168 Square Feet
- Dimensions: 12X14
Heating
- Forced Air
Cooling
- Central Air
Features
- Basement: Finished,Full
Interior area
- Total structure area: 0
- Total interior livable area: 920 sqft
Property
Accessibility
- Accessibility features: No Disability Access
Features
- Stories: 2
Lot
- Size: 4,726 Square Feet
Details
- Parcel number: 15161220250000
- Special conditions: None
Construction
Type & style
- Home type: SingleFamily
- Property subtype: Single Family Residence
Materials
- Brick
Condition
- New construction: No
- Year built: 1947
- Major remodel year: 2022
Utilities & green energy
- Sewer: Public Sewer
- Water: Public
Community & HOA
HOA
- Services included: None
Location
- Region: Bellwood
Financial & listing details
- Price per square foot: $292/sqft
- Tax assessed value: $160,000
- Annual tax amount: $6,228
- Date on market: 11/6/2026
- Ownership: Fee Simple
Estimated market value
$267,300
$254,000 - $281,000
$2,069/mo
Price history
| Date | Event | Price |
|---|---|---|
| 11/6/2026 | Listed for sale | $269,000+963.3%$292/sqft |
Source:  MRED as distributed by MLS GRID #12801136 Report a problem | ||
| 6/17/2011 | Sold | $25,299-15.2%$27/sqft |
Source: MRED as distributed by MLS GRID #07763042 Report a problem | ||
| 5/12/2011 | Price change | $29,840-7%$32/sqft |
Source: Altisource Homes #07763042 Report a problem | ||
| 4/12/2011 | Listed for sale | $32,087-13.5%$35/sqft |
Source: Altisource Homes #07763042 Report a problem | ||
| 2/12/2011 | Listing removed | $37,100$40/sqft |
Source: Altisource Homes #07716607 Report a problem | ||
| 1/23/2011 | Price change | $37,100-9.7%$40/sqft |
Source: Altisource Homes #07716607 Report a problem | ||
| 12/11/2010 | Price change | $41,100-12%$45/sqft |
Source: Altisource Homes #07716607 Report a problem | ||
| 11/14/2010 | Price change | $46,700-11.9%$51/sqft |
Source: Altisource Homes #07716607 Report a problem | ||
| 10/8/2010 | Listed for sale | $53,000-63.2%$58/sqft |
Source: Altisource Homes #07648242 Report a problem | ||
| 7/13/2004 | Sold | $144,000$157/sqft |
Source: Public Record Report a problem | ||
Public tax history
| Year | Property taxes | Tax assessment |
|---|---|---|
| 2024 | $6,015 +5% | $16,000 +0% |
| 2023 | $5,727 -10.7% | $15,999 +2.2% |
| 2022 | $6,411 +0.7% | $15,653 |
| 2021 | $6,369 +0.6% | $15,653 |
| 2020 | $6,330 +94.8% | $15,653 +71.3% |
| 2019 | $3,249 +1.9% | $9,138 |
| 2018 | $3,189 +5.1% | $9,138 |
| 2017 | $3,033 -4.4% | $9,138 +10.7% |
| 2016 | $3,172 +7.4% | $8,256 |
| 2015 | $2,954 -0.2% | $8,256 |
| 2014 | $2,961 -5.3% | $8,256 -11.5% |
| 2013 | $3,127 +1.1% | $9,326 |
| 2012 | $3,092 -3.2% | $9,326 |
| 2011 | $3,195 -25.7% | $9,326 -43.5% |
| 2010 | $4,301 +11% | $16,492 |
| 2009 | $3,874 +14.4% | $16,492 -5% |
| 2008 | $3,386 +3.4% | $17,359 +22.5% |
| 2007 | $3,276 +6.2% | $14,172 |
| 2006 | $3,085 -24% | $14,172 |
| 2005 | $4,060 +19.3% | $14,172 +24.8% |
| 2004 | $3,403 +5.7% | $11,352 |
| 2003 | $3,219 +9% | $11,352 |
| 2002 | $2,952 +13.8% | $11,352 +25.4% |
| 2001 | $2,593 +1.1% | $9,056 |
| 2000 | $2,566 +11.2% | $9,056 |
| 1999 | $2,308 | $9,056 |
Find assessor info on the county website
Monthly payment
Est. payment
Payment breakdown
Explore the cost of this home by adjusting the details. Changes won't be saved.Climate risks
Neighborhood: 60104
Nearby schools
Schools provided by the listing agent
- District: 88
Source: MRED as distributed by MLS GRID. This data may not be complete. We recommend contacting the local school district to confirm school assignments for this home.

Similar homes
- $285,0003 bd2 ba1k sqft1116 Cernan Dr, Bellwood, IL 60104Active
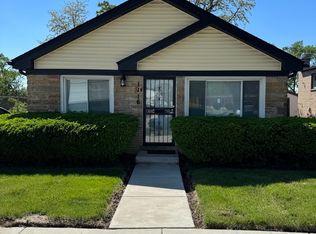 MLS ID #12646558, Deanous Reid, F.J. Williams Realty LLC. MRED as distributed by MLS GRID
- $--4 bd2 ba1k sqft1444 Morris Ave, Berkeley, IL 60163Auction
 MLS ID #12805892, Michael Olszewski, Area Wide Realty. MRED as distributed by MLS GRID
- $265,0002 bd1 ba1k sqft3945 Oak Ave, Brookfield, IL 60513Active
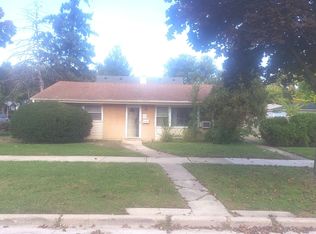 MLS ID #12798720, Kerry Wright, Prestige Partners Realty, Inc.. MRED as distributed by MLS GRID
- $289,9004 bd2 ba984 sqft2000 S 3rd Ave, Maywood, IL 60153Active
 MLS ID #12797905, Michael Olszewski, Area Wide Realty. MRED as distributed by MLS GRID
