$4,825,500
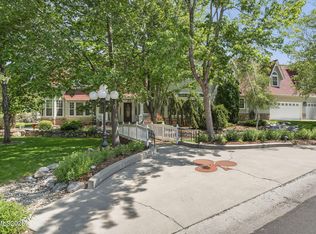
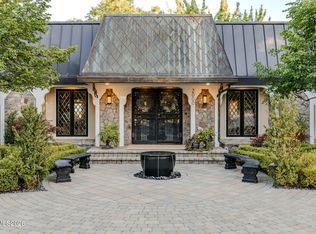
5 bd|8 ba|7.7k sqft
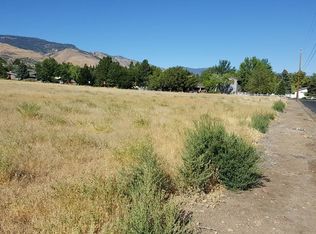
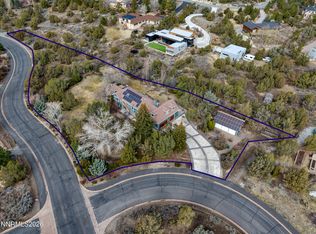
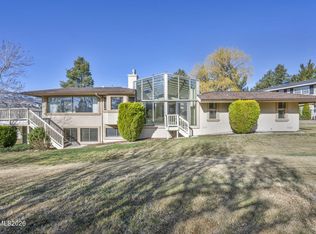
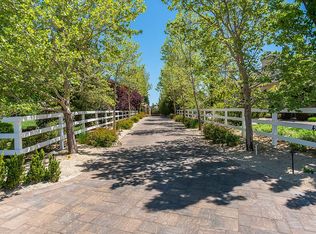
4140 Latigo Ct, Reno, NV 89519
Off Market
Zillow last checked:
Listing updated:
Kirsten Gardner S.176011 775-225-1338,
Dickson Realty - Downtown
Not available
Estimated sales range
Not available
Not available
| Date | Event | Price |
|---|---|---|
| 5/27/2020 | Sold | $1,625,000-3%$333/sqft |
Source: | ||
| 4/28/2020 | Listed for sale | $1,674,999$343/sqft |
Source: Ferrari-Lund Real Estate Reno #190010524 Report a problem | ||
| 2/11/2020 | Pending sale | $1,674,999$343/sqft |
Source: Ferrari-Lund Real Estate Reno #190010524 Report a problem | ||
| 1/15/2020 | Price change | $1,674,999-1.5%$343/sqft |
Source: Ferrari-Lund Real Estate Reno #190010524 Report a problem | ||
| 10/15/2019 | Price change | $1,699,999-1.4%$349/sqft |
Source: Ferrari-Lund Real Estate Reno #190010524 Report a problem | ||
| 10/4/2019 | Price change | $1,725,000-1.4%$354/sqft |
Source: Ferrari-Lund Real Estate Reno #190010524 Report a problem | ||
| 9/5/2019 | Price change | $1,750,000-2.8%$359/sqft |
Source: Ferrari-Lund Real Estate Reno #190010524 Report a problem | ||
| 7/10/2019 | Listed for sale | $1,800,000+287.1%$369/sqft |
Source: Ferrari-Lund Real Estate Reno #190010524 Report a problem | ||
| 3/30/2001 | Sold | $465,000+75.5%$95/sqft |
Source: Public Record Report a problem | ||
| 6/1/1995 | Sold | $265,000$54/sqft |
Source: Public Record Report a problem | ||
| Year | Property taxes | Tax assessment |
|---|---|---|
| 2026 | $9,206 +3% | $331,679 +3.4% |
| 2025 | $8,939 +3% | $320,890 +0.7% |
| 2024 | $8,680 +2.9% | $318,533 +3.2% |
| 2023 | $8,433 +3% | $308,669 -2% |
| 2022 | $8,187 +4.3% | $314,904 +6.1% |
| 2021 | $7,850 +3% | $296,681 +0.5% |
| 2020 | $7,624 -2.9% | $295,298 |
| 2019 | $7,850 +3% | $295,298 +21.6% |
| 2018 | $7,624 +8.9% | $242,761 -0.4% |
| 2017 | $7,000 | $243,818 +8.8% |
| 2016 | $7,000 | $224,018 -1.2% |
| 2015 | $7,000 +3% | $226,795 +8.7% |
| 2014 | $6,795 | $208,578 +3% |
| 2013 | $6,795 | $202,485 |
| 2012 | -- | $202,485 +0.6% |
| 2011 | -- | $201,239 -6.5% |
| 2010 | -- | $215,289 -14.7% |
| 2009 | -- | $252,353 -15.8% |
| 2008 | -- | $299,632 +14% |
| 2007 | -- | $262,925 +31.2% |
| 2006 | -- | $200,420 +7.4% |
| 2005 | -- | $186,561 -0.4% |
| 2004 | -- | $187,342 +95.6% |
| 2003 | -- | $95,788 +0.5% |
| 2002 | -- | $95,309 |
| 2001 | -- | $95,309 |
Find assessor info on the county website
Source: NNRMLS. This data may not be complete. We recommend contacting the local school district to confirm school assignments for this home.
A local agent can set up tours, give advice and negotiate with sellers.