Prime Uptown Location! Just one block from the iconic intersection of St. Charles Avenue and Napoleon Avenue, this fully leased tri-plex is ideally positioned in the heart of Uptown Mardi Gras festivities. The property offers an excellent investment opportunity with three long-term tenants generating $4,000 per month in rental income.Each unit features spacious rooms, abundant natural light from large windows, beautiful wood floors, gas cooking, central air and heat, range/oven, refrigerator, and an in-unit washer and dryer. Off-street parking for two cars adds valuable convenience.Whether you're looking for a solid income-producing property or envision transforming the property into a beautiful single-family home, the possibilities are endless in this exceptional Uptown location.
For sale
Price cut: $26K (11/10)
$499,000
4320 Pitt St, New Orleans, LA 70115
3beds
--sqft
Triplex
Built in 1895
-- sqft lot
$485,200 Zestimate®
$--/sqft
$-- HOA
What's special
Gas cookingIn-unit washer and dryerCentral air and heatSpacious roomsBeautiful wood floors
- 20 days
- 335
- 28
Likely to sell faster than
Zillow last checked:
Listing updated:
Listed by:
Mary T Dodart,
Compass Uptown 504-866-2785
Source: ROAM MLS,MLS#: 2579771
Facts & features
Interior
Bedrooms & bathrooms
- Bedrooms: 3
- Bathrooms: 4
- Full bathrooms: 4
Heating
- Central
Cooling
- Central Air
Appliances
- Laundry: Electric Dryer Hookup, In Unit
Interior area
- Total structure area: 2,531
Video & virtual tour
Property
Parking
- Total spaces: 2
- Parking features: Driveway
- Has uncovered spaces: Yes
Lot
- Size: 3,120 Square Feet
- Dimensions: 30 x 104/105
- Features: Other
Details
- Parcel number: 614225704
Construction
Type & style
- Home type: MultiFamily
- Architectural style: Traditional
- Property subtype: Triplex
Materials
- Vinyl Siding
- Foundation: Raised
Condition
- Year built: 1895
Utilities & green energy
- Sewer: Public Sewer
- Water: Public
- Utilities for property: Natural Gas Available
Community & HOA
Location
- Region: New Orleans
Financial & listing details
- Tax assessed value: $543,200
- Annual tax amount: $7,170
- Date on market: 11/10/2026
- Tenant pays: Electricity, Gas
Estimated market value
$485,200
$461,000 - $509,000
Not available
Price history
| Date | Event | Price |
|---|---|---|
| 11/10/2026 | Price change | $499,000-5% |
Source:  ROAM MLS #2579771 Report a problem | ||
| 11/2/2026 | Pending sale | $525,000 |
Source: ROAM MLS #2579771 Report a problem | ||
| 10/23/2026 | Price change | $525,000-8.7% |
Source: ROAM MLS #2579771 Report a problem | ||
| 10/5/2026 | Listed for sale | $575,000 |
Source:  GSREIN #2579771 Report a problem | ||
| 1/4/2026 | Listing removed | $1,300 |
Source: Zillow Rentals Report a problem | ||
| 1/2/2026 | Listed for rent | $1,300-27.8% |
Source: Zillow Rentals Report a problem | ||
| 4/7/2025 | Listing removed | $1,800 |
Source: Zillow Rentals Report a problem | ||
| 3/30/2025 | Listed for rent | $1,800 |
Source: Zillow Rentals Report a problem | ||
| 12/21/2023 | Listing removed | -- |
Source: Zillow Rentals Report a problem | ||
| 11/30/2023 | Listed for rent | $1,800 |
Source: Zillow Rentals Report a problem | ||
| 10/25/2022 | Listing removed | -- |
Source: Zillow Rental Network_1 Report a problem | ||
| 10/21/2022 | Listed for rent | $1,800 |
Source: Zillow Rental Network_1 Report a problem | ||
| 6/26/2021 | Listing removed | -- |
Source: Zillow Rental Network_1 Report a problem | ||
| 6/25/2021 | Listed for rent | $1,800+12.5% |
Source: Zillow Rental Network_1 Report a problem | ||
| 3/24/2021 | Listing removed | -- |
Source: Owner Report a problem | ||
| 5/17/2019 | Listing removed | $1,600 |
Source: Owner Report a problem | ||
| 5/16/2019 | Price change | $1,600-11.1% |
Source: Owner Report a problem | ||
| 5/11/2019 | Listed for rent | $1,800 |
Source: Owner Report a problem | ||
| 12/28/2012 | Sold | -- |
Source: Agent Provided Report a problem | ||
| 12/17/1971 | Sold | -- |
Source: Agent Provided Report a problem | ||
Public tax history
| Year | Property taxes | Tax assessment |
|---|---|---|
| 2026 | $7,170 | $54,320 |
| 2025 | $7,170 -1.5% | $54,320 |
| 2024 | $7,278 -20.5% | $54,320 -16.5% |
| 2023 | $9,159 -0.8% | $65,090 +4.5% |
| 2022 | $9,232 -6.3% | $62,290 -4.3% |
| 2021 | $9,858 +60.7% | $65,090 +63.3% |
| 2020 | $6,135 +1.9% | $39,870 |
| 2019 | $6,024 | $39,870 |
| 2018 | $6,024 | $39,870 |
| 2017 | $6,024 -5.9% | $39,870 +19.1% |
| 2016 | $6,402 +19.8% | $33,490 |
| 2015 | $5,344 | $33,490 |
| 2014 | $5,344 +2% | $33,490 +285.8% |
| 2013 | $5,240 | $8,680 |
| 2012 | -- | $8,680 |
| 2011 | -- | $8,680 |
| 2010 | -- | $8,680 |
| 2009 | -- | $8,680 |
| 2007 | -- | $8,680 |
| 2006 | -- | $8,680 |
| 2004 | -- | $8,680 |
| 2002 | -- | $8,680 |
| 2001 | -- | $8,680 |
| 2000 | -- | $8,680 |
Find assessor info on the county website
Monthly payment
Est. payment
Payment breakdown
Explore the cost of this home by adjusting the details. Changes won't be saved.Climate risks
Neighborhood: Touro
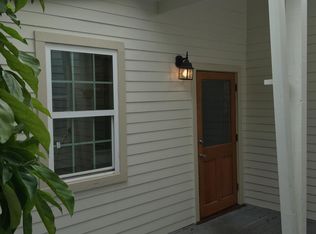
- $--2 bd2 ba-- sqft4320 Pitt St APT B, New Orleans, LA 70115Off Market
- $1,029,800-- bd-- ba3.3k sqft1422 General Pershing St, New Orleans, LA 70115Off Market
- $--4 bd5 ba3k sqft1424 General Pershing St, New Orleans, LA 70115Sold

- $--2 bd1 ba800 sqft1424 General Pershing St #B, New Orleans, LA 70115Off Market

Similar homes
- $499,0003 bd3 ba1.8k sqft614 9th St, New Orleans, LA 70115For Sale

 MLS ID #200QKN, Stephen S Mock, REVE, REALTORS. ROAM MLS
- $475,0003 bd2 ba-- sqft809 Toledano St, New Orleans, LA 70115For Sale
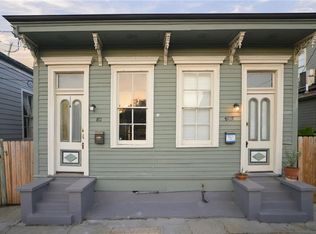 MLS ID #2582284, Kasi L Champagne, eXp Realty, LLC. ROAM MLS
- $485,0004 bd2 ba-- sqft2424 Valence St, New Orleans, LA 70115For Sale
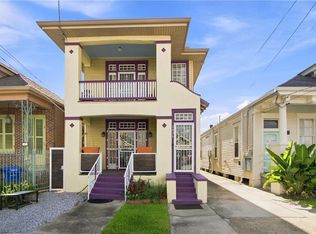 MLS ID #2575621, Philip J Ewbank, Keller Williams Realty New Orleans. ROAM MLS
- $395,0004 bd4 ba-- sqft4132-34 Constance St, New Orleans, LA 70115For Sale
 MLS ID #2543805, Kimberly S Davis, Berkshire Hathaway HS - Garden District/Uptown. ROAM MLS
- $399,9002 bd2 ba1k sqft2019 Jena St, New Orleans, LA 70115For SaleMLS ID #200SPZ, Blaine H Tatje, Team Tatje Realtors, LLC. ROAM MLS
- $550,0002 bd2 ba-- sqft5416 Laurel St, New Orleans, LA 70115For SaleMLS ID #2559876, Sarah T Aucoin, Coldwell Banker TEC Magazine. ROAM MLS
- $535,0002 bd3 ba1.4k sqft4022 Annunciation St, New Orleans, LA 70115For SaleMLS ID #2576059, Celeste Marshall, REVE, REALTORS. ROAM MLS
- $459,9003 bd2 ba2.2k sqft1419 Pine St, New Orleans, LA 70118For SaleMLS ID #200UBB, Albert E Sidhom, KELLER WILLIAMS REALTY 4550100. ROAM MLS
- $419,0003 bd2 ba1.2k sqft4201 Tchoupitoulas St, New Orleans, LA 70115For SaleMLS ID #2572482, Gary D Lazarus, REMAX N.O. Properties. ROAM MLS
- $620,0002 bd3 ba-- sqft2823 Constance St, New Orleans, LA 70115For SaleMLS ID #200JKX, William Martin Borrouso, Borrouso Realty. ROAM MLS
- $385,0002 bd1 ba-- sqft2525-27 Nashville Ave, New Orleans, LA 70115For SaleMLS ID #2570867, Meghan Carollo, Ricci Real Estate. ROAM MLS
- $640,0003 bd3 ba1.9k sqft4617 S Saratoga St, New Orleans, LA 70115For SaleMLS ID #2566261, Alexander W Peet, Wurth Real Estate Services. ROAM MLS
- $685,0002 bd4 ba-- sqft1820 Toledano St, New Orleans, LA 70115For SaleMLS ID #2564138, Joshua K Walther, Witry Collective, L.L.C.. ROAM MLS
- $599,0003 bd2 ba1.5k sqft742 Delachaise St, New Orleans, LA 70115For SaleMLS ID #2568380, Michael Wilkinson, FQR Realtors. ROAM MLS
- $539,0004 bd4 ba-- sqft331 S Norman C Francis Pkwy, New Orleans, LA 70119For SaleMLS ID #2567949, James A Henderson, James Henderson Properties. ROAM MLS
- $489,0002 bd2 ba1.4k sqft8221 Zimpel St, New Orleans, LA 70118For SaleMLS ID #2574021, Jennifer Saltaformaggio, Compass Historic. ROAM MLS
- $429,0004 bd4 ba-- sqft4423-4425 S Johnson St, New Orleans, LA 70125For SaleMLS ID #2551235, David A Hipp, LALLA Real Estate, LLC. ROAM MLS
- $675,0003 bd3 ba1.7k sqft1220 Harmony St #1220, New Orleans, LA 70115For SaleMLS ID #2578843, Bryan Francher, Compass Uptown-Maple St. ROAM MLS
- $485,0002 bd6 ba-- sqft435 Newton St, New Orleans, LA 70114For SaleMLS ID #2576138, Kara K Breithaupt, Snap Realty. ROAM MLS
- $515,0003 bd2 ba1.8k sqft2425 Audubon St, New Orleans, LA 70125For SaleMLS ID #2572313, Tracey W Moore, REVE, REALTORS. ROAM MLS
