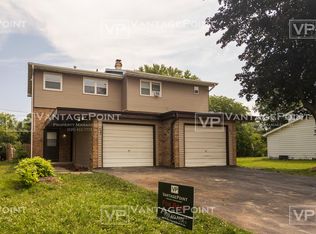
Well kept side by side duplex, in a quaint neighborhood within walking distance to the fox river. Perfect for house hackers or investors looking to grow their portfolio. long term tenants in 433 that are month-month, 435 will be vacant as of 10/01/2026. Partially finished basement, all appliances included besides washer and dryer that is tenant owned.
Active-no offer
Price cut: $10.9K (11/7)
$399,000
433 N Saint Bernard Dr, De Pere, WI 54115
5beds
4baths
2,664sqft
Duplex
Built in 1970
-- sqft lot
$399,200 Zestimate®
$150/sqft
$-- HOA
What's special
Partially finished basementAll appliances included
- 68 days
- 572
- 17
Zillow last checked:
Listing updated:
Listed by:
Hayley M Gracyalny 920-619-7439,
Rooted Realty
Source: RANW as distributed by MLS GRID,MLS#: 50332095
Facts & features
Interior
Bedrooms & bathrooms
- Bedrooms: 5
- Bathrooms: 4
Interior area
- Total interior livable area: 2,664 sqft
- Finished area above ground: 2,664
- Finished area below ground: 0
Property
Parking
- Parking features: Attached
- Has attached garage: Yes
Accessibility
- Accessibility features: Not Applicable
Lot
- Size: 0.25 Acres
Details
- Parcel number: ED371B16
- Zoning: 2 Family/Duplex
Construction
Type & style
- Home type: MultiFamily
- Property subtype: Duplex
Materials
- Shake Siding
- Foundation: Poured Concrete
Condition
- New construction: No
- Year built: 1970
Utilities & green energy
- Sewer: Public Sewer
- Water: Public
Community & HOA
Location
- Region: De Pere
Financial & listing details
- Price per square foot: $150/sqft
- Tax assessed value: $320,200
- Annual tax amount: $4,952
- Date on market: 9/3/2026
Estimated market value
$399,200
$379,000 - $419,000
$1,455/mo
Price history
| Date | Event | Price |
|---|---|---|
| 11/7/2026 | Price change | $399,000-2.7%$150/sqft |
Source: RANW as distributed by MLS GRID #50332095 Report a problem | ||
| 10/29/2026 | Listed for sale | $409,900$154/sqft |
Source:  WIREX MLS #50332095 Report a problem | ||
| 9/14/2026 | Contingent | $409,900$154/sqft |
Source: WIREX MLS #50332095 Report a problem | ||
| 9/3/2026 | Listed for sale | $409,900+121.3%$154/sqft |
Source: WIREX MLS #50332095 Report a problem | ||
| 4/5/2019 | Sold | $185,214+83.4%$70/sqft |
Source: RANW as distributed by MLS GRID #50197605 Report a problem | ||
| 9/30/2013 | Sold | $101,000-2.3%$38/sqft |
Source: Agent Provided Report a problem | ||
| 5/19/2013 | Price change | $103,400-7.8%$39/sqft |
Source: RE/MAX 24/7 #50073549 Report a problem | ||
| 5/15/2013 | Price change | $112,100-14.6%$42/sqft |
Source: RE/MAX 24/7 #50073549 Report a problem | ||
| 4/13/2013 | Listed for sale | $131,280+6.7%$49/sqft |
Source: RE/MAX 24/7 Real Estate #50073549 Report a problem | ||
| 1/24/2012 | Listing removed | $123,079$46/sqft |
Source: Coldwell Banker The Real Estate Group #GO622 Report a problem | ||
| 10/26/2011 | Listed for sale | $123,079-31.2%$46/sqft |
Source: Coldwell Banker The Real Estate Group #GO622 Report a problem | ||
| 4/3/2011 | Listing removed | $179,000$67/sqft |
Source: Micoley & Company #50009735 Report a problem | ||
| 2/26/2011 | Listed for sale | $179,000$67/sqft |
Source: Micoley & Company #50009735 Report a problem | ||
Public tax history
| Year | Property taxes | Tax assessment |
|---|---|---|
| 2025 | $4,952 +10.4% | $320,200 +12.5% |
| 2024 | $4,484 +19.3% | $284,700 +15.1% |
| 2023 | $3,760 +7.1% | $247,400 +11.1% |
| 2022 | $3,511 +5% | $222,700 +12.1% |
| 2021 | $3,345 -1.6% | $198,700 +7.2% |
| 2020 | $3,398 -3.7% | $185,300 +6.4% |
| 2019 | $3,530 -3.2% | $174,200 +3.3% |
| 2018 | $3,645 +7.3% | $168,600 +9.9% |
| 2017 | $3,397 -1.8% | $153,400 |
| 2016 | $3,460 -14.5% | $153,400 -6.5% |
| 2015 | $4,047 -4.6% | $164,100 |
| 2014 | $4,241 | $164,100 |
Find assessor info on the county website
Monthly payment
Est. payment
Payment breakdown
Explore the cost of this home by adjusting the details. Changes won't be saved.Climate risks
Neighborhood: 54115

Similar homes
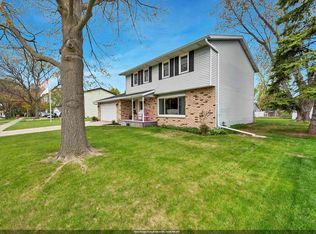
- $399,9003 bd3 ba2k sqft413 S Good Hope Rd, De Pere, WI 54115For Sale
 MLS ID #50330281, Dina K DeGroot. RANW as distributed by MLS GRID
- $349,9004 bd3 ba2.1k sqft1636 Lost Dauphin Rd, De Pere, WI 54115For Sale
 MLS ID #50334827, Diane Campshure Walczyk. RANW as distributed by MLS GRID
- $424,9004 bd3 ba2.4k sqft2075 W Vista Cir, De Pere, WI 54115For Sale
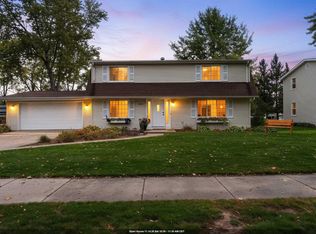 MLS ID #50334211, Maureen L Horst. RANW as distributed by MLS GRID
- $349,9004 bd2 ba1.8k sqft918 Saint Marys St, De Pere, WI 54115For Sale
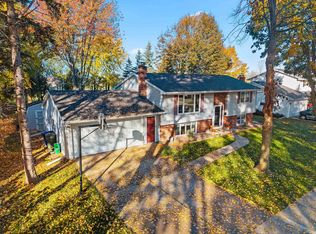 MLS ID #50335114, Lisa Clark. RANW as distributed by MLS GRID
