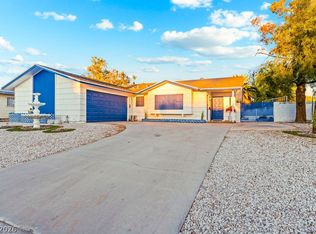
Move in ready remodeled home with fresh paint throughout. Home features custom cabinets, granite countertops and island. Bathrooms include new vanity, tub & tile floors. Lot features private gated pool
Foreclosed
Est. $427,100
4907 Billman Ave, Las Vegas, NV 89121
5beds
1,588sqft
Single Family Residential
Built in 1962
6,098 Square Feet Lot
$427,100 Zestimate®
$269/sqft
$-- HOA
Overview
- 275 days
- 12
- 3
Facts & features
Interior
Bedrooms & bathrooms
- Bedrooms: 5
- Bathrooms: 3
- Full bathrooms: 2
- 1/2 bathrooms: 1
Heating
- Forced air, Electric
Cooling
- Central
Appliances
- Included: Dryer, Microwave, Washer
- Laundry: Separate Laundry Area
Features
- Ceiling Fan(s), Central Vacuum
- Flooring: Tile, Carpet, Laminate
- Has fireplace: Yes
- Fireplace features: Wood Burning, Living Room
Interior area
- Total interior livable area: 1,588 sqft
Property
Parking
- Total spaces: 1
- Parking features: Carport, Garage - Attached
Features
- Exterior features: Stucco
- Pool features: Inground-Private
- Fencing: Back Yard, COMMUNITY Wall
Lot
- Size: 6,098 Square Feet
- Features: Desert Landscaping, Under 1/4 Acre, Rock/Gravel Landscaping
Details
- Additional structures: Shed(s)
- Parcel number: 16120711060
- Zoning description: Single Family
Construction
Type & style
- Home type: SingleFamily
- Property subtype: Single Family Residential
Materials
- masonry
- Roof: Composition
Condition
- Year built: 1962
Utilities & green energy
- Sewer: Public Sewer
- Water: Public
- Utilities for property: Natural Gas Not Available, Underground Utilities, Cable TV Wired, All Electric
Community & HOA
Location
- Region: Las Vegas
Financial & listing details
- Price per square foot: $269/sqft
- Tax assessed value: $150,926
- Annual tax amount: $2,047
- Inclusions: Dryer included, Washer Included
Foreclosure details
Estimated market value
$427,100
$401,000 - $448,000
$2,673/mo
Price history
| Date | Event | Price |
|---|---|---|
| 2/4/2026 | Sold | $336,200+24.7%$212/sqft |
Source: Public Record Report a problem | ||
| 12/28/2020 | Sold | $269,500+1.7%$170/sqft |
Source:  LVR #2250839 Report a problem | ||
| 11/26/2020 | Listed for sale | $265,000+65.6%$167/sqft |
Source: The Collective Real Estate Adv #2250839 Report a problem | ||
| 5/23/2017 | Sold | $160,000+3.3%$101/sqft |
Source: LVR #1884646 Report a problem | ||
| 4/22/2017 | Listed for sale | $154,900$98/sqft |
Source: CENTURY 21 Americana #1884646 Report a problem | ||
| 4/13/2017 | Pending sale | $154,900$98/sqft |
Source: CENTURY 21 Americana #1884646 Report a problem | ||
| 4/8/2017 | Listed for sale | $154,900+3.3%$98/sqft |
Source: Century 21 Americana #1884646 Report a problem | ||
| 4/21/2016 | Listing removed | $150,000$94/sqft |
Source: United Realty Group #1583588 Report a problem | ||
| 3/28/2016 | Pending sale | $150,000$94/sqft |
Source: United Realty Group #1583588 Report a problem | ||
| 3/22/2016 | Listed for sale | $150,000$94/sqft |
Source: United Realty Group #1583588 Report a problem | ||
| 3/6/2016 | Pending sale | $150,000$94/sqft |
Source: United Realty Group #1583588 Report a problem | ||
| 3/1/2016 | Listed for sale | $150,000$94/sqft |
Source: United Realty Group #1583588 Report a problem | ||
| 2/25/2016 | Pending sale | $150,000$94/sqft |
Source: United Realty Group #1583588 Report a problem | ||
| 2/19/2016 | Price change | $150,000-2%$94/sqft |
Source: United Realty Group #1583588 Report a problem | ||
| 2/13/2016 | Price change | $153,000-0.3%$96/sqft |
Source: United Realty Group #1583588 Report a problem | ||
| 2/5/2016 | Pending sale | $153,500$97/sqft |
Source: United Realty Group #1583588 Report a problem | ||
| 1/2/2016 | Price change | $153,500-2.8%$97/sqft |
Source: Signature Gallery Of Homes #1583588 Report a problem | ||
| 11/11/2015 | Price change | $158,000-6.5%$99/sqft |
Source: Signature Gallery Of Homes #1583588 Report a problem | ||
| 10/31/2015 | Price change | $168,900-0.6%$106/sqft |
Source: Signature Gallery Of Homes #1583588 Report a problem | ||
| 10/26/2015 | Listed for sale | $170,000+36%$107/sqft |
Source: Signature Gallery Of Homes #1583588 Report a problem | ||
| 4/25/2014 | Sold | $125,000+66.7%$79/sqft |
Source: LVR #1410755 Report a problem | ||
| 9/18/2011 | Listing removed | $1,050$1/sqft |
Source: Better Homes and Gardens Real #1166617 Report a problem | ||
| 9/5/2011 | Price change | $1,050-4.5%$1/sqft |
Source: Better Homes and Gardens Real #1166617 Report a problem | ||
| 8/5/2011 | Price change | $1,100-8.3%$1/sqft |
Source: Better Homes and Gardens Real #1166617 Report a problem | ||
| 7/21/2011 | Listed for rent | $1,200$1/sqft |
Source: Better Homes and Gardens Real #1166617 Report a problem | ||
| 6/23/2011 | Listing removed | $75,000$47/sqft |
Source: Realty Executives Experts #1109116 Report a problem | ||
| 4/7/2011 | Listed for sale | $75,000$47/sqft |
Source: Realty Executives Experts #1109116 Report a problem | ||
Public tax history
| Year | Property taxes | Tax assessment |
|---|---|---|
| 2026 | $2,047 +157.9% | $52,824 +0.2% |
| 2025 | $794 +7.9% | $52,725 -2.3% |
| 2024 | $736 +8% | $53,963 +13.1% |
| 2023 | $681 +8% | $47,710 +12.6% |
| 2022 | $631 +7.8% | $42,359 +14.8% |
| 2021 | $586 -29.6% | $36,893 +5.1% |
| 2020 | $832 +2.9% | $35,111 +6.4% |
| 2019 | $808 +65.1% | $32,990 |
| 2018 | $490 | $32,990 +3.7% |
| 2017 | $490 | $31,817 +14.9% |
| 2016 | $490 +0.5% | $27,685 +16.7% |
| 2015 | $487 +3.2% | $23,722 +9.2% |
| 2014 | $472 | $21,728 |
| 2013 | -- | $21,728 +18.6% |
| 2012 | -- | $18,328 +26% |
| 2011 | -- | $14,550 -24.3% |
| 2010 | -- | $19,216 -40.9% |
| 2009 | -- | $32,516 |
| 2008 | -- | $32,516 -39.9% |
| 2007 | -- | $54,083 +23.5% |
| 2006 | -- | $43,790 +32.2% |
| 2005 | -- | $33,114 +15.9% |
| 2004 | -- | $28,567 +0.3% |
| 2003 | -- | $28,480 -1.1% |
| 2002 | -- | $28,810 +4% |
| 2001 | -- | $27,690 |
Find assessor info on the county website
Monthly payment
Climate risks
Neighborhood: Paradise
Nearby schools
Schools provided by the listing agent
- Elementary: Ullom JM
- Middle: Woodbury C. W.
- High: Chaparral
Source: The MLS. This data may not be complete. We recommend contacting the local school district to confirm school assignments for this home.

Similar homes
- $435,0003 bd2 ba1.3k sqft4331 El Esteban Way, Las Vegas, NV 89121For Sale
 MLS ID #2832331, Richard J. Brenkus, Keller Williams MarketPlace. LVR
- $435,0005 bd3 ba1.8k sqft4966 Lana Dr, Paradise Town, NV 89121For Sale
 MLS ID #2824727, Blake G. Lathrop, Savi Realty LLC. LVR
- $480,0004 bd3 ba1.4k sqft3950 Syracuse Dr, Las Vegas, NV 89121For Sale
 MLS ID #2832433, Michel Prieto Acosta, DH Capital Realty. LVR
- $379,9004 bd2 ba1.2k sqft4792 Rita Dr, Las Vegas, NV 89121For Sale
 MLS ID #2831068, Valerie A. Prospero, BHHS Nevada Properties. LVR
