$38,000
-- bd|-- ba|-- sqft
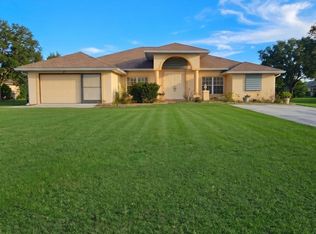
22002 Peachland Blvd, Pt Charlotte, FL 33954
Off Market
Likely to sell faster than
Zillow last checked:
Listing updated:
Jodi-Ann Murray 561-429-5698,
1ST CLASS REAL ESTATE DOMINION PROPERTIES
$362,500
$344,000 - $381,000
$2,295/mo
| Date | Event | Price |
|---|---|---|
| 8/12/2022 | Listing removed | -- |
Source: | ||
| 8/12/2022 | Listed for sale | $399,800$207/sqft |
Source: | ||
| 8/4/2022 | Pending sale | $399,800$207/sqft |
Source: | ||
| 8/1/2022 | Price change | $399,800-2.5%$207/sqft |
Source: | ||
| 7/29/2022 | Price change | $409,900-1.2%$212/sqft |
Source: | ||
| 7/13/2022 | Price change | $414,900-1.2%$214/sqft |
Source: | ||
| 6/27/2022 | Price change | $419,900-1.2%$217/sqft |
Source: | ||
| 6/1/2022 | Listed for sale | $424,900$220/sqft |
Source: | ||
| 5/18/2022 | Pending sale | $424,900-5.6%$220/sqft |
Source: | ||
| 4/22/2022 | Price change | $449,900-4.3%$233/sqft |
Source: | ||
| 4/11/2022 | Price change | $469,900+22.1%$243/sqft |
Source: | ||
| 4/7/2022 | Price change | $385,000+83.3%$199/sqft |
Source: Owner Report a problem | ||
| 1/30/2020 | Price change | $210,000-8.7%$109/sqft |
Source: Keller Williams Realty Fort My #219082361 Report a problem | ||
| 1/25/2020 | Price change | $230,000-4.2%$119/sqft |
Source: Keller Williams Realty Fort My #219082361 Report a problem | ||
| 12/31/2019 | Price change | $240,000-7.7%$124/sqft |
Source: Keller Williams Realty Fort My #219082361 Report a problem | ||
| 12/18/2019 | Listed for sale | $260,000+15.6%$134/sqft |
Source: Keller Williams Realty Fort My #219082361 Report a problem | ||
| 8/28/2018 | Sold | $225,000$116/sqft |
Source: Public Record Report a problem | ||
| 7/12/2018 | Pending sale | $225,000$116/sqft |
Source: Coldwell Banker Sunstar Realty #C7400742 Report a problem | ||
| 6/4/2018 | Price change | $225,000-6.3%$116/sqft |
Source: Coldwell Banker Morris Realty #C7400742 Report a problem | ||
| 4/26/2018 | Listed for sale | $240,000$124/sqft |
Source: COLDWELL BANKER SUNSTAR REALTY #C7400742 Report a problem | ||
| Year | Property taxes | Tax assessment |
|---|---|---|
| 2025 | $6,009 -11.2% | $346,969 -12% |
| 2024 | $6,766 -3.1% | $394,328 -0.3% |
| 2023 | $6,983 +190.2% | $395,331 +167.4% |
| 2022 | $2,406 +0.5% | $147,817 +3% |
| 2021 | $2,395 +2.2% | $143,512 +1.4% |
| 2020 | $2,344 -9.9% | $141,531 -11.1% |
| 2019 | $2,603 +16.4% | $159,236 +9% |
| 2018 | $2,237 | $146,094 +2.1% |
| 2017 | $2,237 +1.1% | $143,089 +2.1% |
| 2016 | $2,213 +0.7% | $140,146 +0.7% |
| 2015 | $2,198 +0.3% | $139,172 +0.8% |
| 2014 | $2,192 +31.1% | $138,067 +3.2% |
| 2013 | $1,671 +4.3% | $133,753 -3.3% |
| 2012 | $1,602 -3.6% | $138,278 |
| 2011 | $1,662 -1.5% | $138,278 +0.5% |
| 2010 | $1,687 +11.4% | $137,595 +2.7% |
| 2009 | $1,515 | $133,978 +5.7% |
| 2007 | -- | $126,777 |
| 2006 | -- | $126,777 +6.1% |
| 2005 | -- | $119,499 +1.9% |
| 2004 | -- | $117,271 |
| 2003 | -- | $117,271 +2.4% |
| 2002 | $1,779 +2.8% | $114,522 +1.6% |
| 2001 | $1,730 +4.9% | $112,719 +3% |
| 2000 | $1,650 | $109,436 |
Find assessor info on the county website
Source: BeachesMLS. This data may not be complete. We recommend contacting the local school district to confirm school assignments for this home.
A local agent can set up tours, give advice and negotiate with sellers.