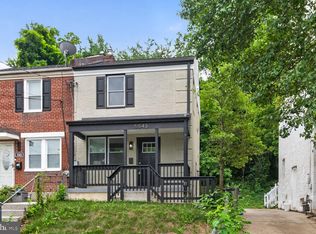
This 1230 square foot single family home has 3 bedrooms and 1.5 bathrooms. This home is located at 5530 Jay St NE, Washington, DC 20019.
Foreclosed
Street View
Est. $354,000
5530 Jay St NE, Washington, DC 20019
3beds
1baths
1,230sqft
SingleFamily
Built in 1965
5,645 Square Feet Lot
$354,000 Zestimate®
$288/sqft
$-- HOA
Overview
- 10 days |
- 5 |
- 0 |
Facts & features
Interior
Bedrooms & bathrooms
- Bedrooms: 3
- Bathrooms: 1.5
Heating
- Forced air
Features
- Flooring: Hardwood
Interior area
- Total interior livable area: 1,230 sqft
Property
Features
- Exterior features: Brick
Lot
- Size: 5,645 Square Feet
Details
- Parcel number: 52140142
Construction
Type & style
- Home type: SingleFamily
Materials
- Roof: Built-up
Condition
- Year built: 1965
Community & HOA
Location
- Region: Washington
Financial & listing details
- Price per square foot: $288/sqft
- Tax assessed value: $359,760
- Annual tax amount: $690
Visit our professional directory to find a foreclosure specialist in your area that can help with your home search.
Find a foreclosure agentForeclosure details
Estimated market value
$354,000
$336,000 - $372,000
$3,008/mo
Price history
| Date | Event | Price |
|---|---|---|
| 6/23/2026 | Sold | $343,000$279/sqft |
Source: Public Record Report a problem | ||
Public tax history
| Year | Property taxes | Tax assessment |
|---|---|---|
| 2025 | $690 +0.3% | $355,220 +2.5% |
| 2024 | $688 +0.1% | $346,700 +4.4% |
| 2023 | $687 -1.2% | $332,000 +11.1% |
| 2022 | $696 +3.5% | $298,790 +4.6% |
| 2021 | $672 +4.6% | $285,740 +4.9% |
| 2020 | $643 -45.7% | $272,470 +17.4% |
| 2018 | $1,185 +9.3% | $231,990 +3.9% |
| 2017 | $1,084 +9.4% | $223,340 +11.6% |
| 2016 | $991 +9.7% | $200,150 +12.6% |
| 2015 | $904 +4% | $177,740 +3.1% |
| 2014 | $869 -5.5% | $172,420 -2.7% |
| 2013 | $920 -11.7% | $177,290 -6.9% |
| 2012 | $1,042 | $190,450 |
| 2011 | $1,042 +21% | $190,450 -24.8% |
| 2010 | $861 +42.9% | $253,270 -7.2% |
| 2009 | $603 +5.2% | $272,930 +34.8% |
| 2007 | $573 +5.2% | $202,460 +48.2% |
| 2006 | $545 -25.2% | $136,570 +20% |
| 2005 | $728 +11.8% | $113,810 +5% |
| 2004 | $651 +12% | $108,390 +19.7% |
| 2003 | $581 | $90,550 |
| 2002 | $581 | $90,550 |
| 2001 | $581 | $90,550 |
Find assessor info on the county website
Monthly payment
Estimated monthly payment$1,822
All calculations are estimates and provided by Zillow, Inc. for informational purposes only. Actual amounts may vary.
HOA fees may include property taxes on listings classified as Co-Ops. Contact the listing agent and/or owner for fee details.
Mortgage interest rates are dependent on a number of factors, including credit score, down payment, and repayment length. Interest rate data provided by Zillow Group Marketplace, Inc. as of 1/1/1970 from various mortgage lenders with which we have lead or other similar arrangements; the Estimated Payment is an average of those rates.
See how much you could borrow to make a competitive offer.
Climate risks
Neighborhood: Burrville
Nearby schools
GreatSchools rating
- 4/10Burrville Elementary SchoolGrades: PK-5Distance: 0.2 mi
- 3/10Kelly Miller Middle SchoolGrades: 6-8Distance: 0.8 mi
- 4/10H.D. Woodson High SchoolGrades: 9-12Distance: 0.2 mi


Nearby cities
Nearby neighborhoods
Nearby zip codes
Other Washington Topics
