MODERN RANCH STYLE WITH A FARMHOUSE FEEL. This Bennett Model is Located in Citrus Springs right on the border of Pine Ridge on .29 Acre corner lot. Discounted pre-sale pricing offered with move in ready date of December 2026 before the holiday and new year. Reach out to see it. 352.270.1199
For sale by owner
$420,000
5838 N Summerfield Point, Citrus Springs, FL 34434
3beds
2,410sqft
SingleFamily
Built in 2026
0.92 Acres Lot
$-- Zestimate®
$174/sqft
$-- HOA
What's special
Modern ranch styleFarmhouse feel
- 29 days
- 191
- 10
Listed by:
Property Owner (352) 270-1199
Facts & features
Interior
Bedrooms & bathrooms
- Bedrooms: 3
- Bathrooms: 2
- Full bathrooms: 2
Interior area
- Total interior livable area: 2,410 sqft
Property
Lot
- Size: 0.92 Acres
Details
- Parcel number: 18E17S100230173900030
Construction
Type & style
- Home type: SingleFamily
Condition
- New construction: No
- Year built: 2026
Community & HOA
Location
- Region: Citrus Springs
Financial & listing details
- Price per square foot: $174/sqft
- Tax assessed value: $15,710
- Annual tax amount: $311
- Date on market: 9/25/2026
Estimated market value
Not available
Estimated sales range
Not available
$2,119/mo
Price history
| Date | Event | Price |
|---|---|---|
| 9/25/2026 | Listed for sale | $420,000+2370.6%$174/sqft |
Source: Owner Report a problem | ||
| 5/17/2024 | Sold | $17,000+31.8%$7/sqft |
Source: Public Record Report a problem | ||
| 9/27/2021 | Sold | $12,900$5/sqft |
Source:  Realtors Association of Citrus County #805313 Report a problem | ||
| 9/5/2021 | Pending sale | $12,900$5/sqft |
Source: Realtors Association of Citrus County #805313 Report a problem | ||
| 9/2/2021 | Listed for sale | $12,900$5/sqft |
Source: Realtors Association of Citrus County #805313 Report a problem | ||
Public tax history
| Year | Property taxes | Tax assessment |
|---|---|---|
| 2025 | $311 +66.8% | $15,710 +99.7% |
| 2024 | $186 +5.8% | $7,865 +10% |
| 2023 | $176 -43.3% | $7,150 +10% |
| 2022 | $311 +17.6% | $6,500 +106.4% |
| 2021 | $264 +1.6% | $3,149 +1.3% |
| 2020 | $260 +4.9% | $3,110 +19.5% |
| 2019 | $248 +10.4% | $2,603 -17.4% |
| 2018 | $225 | $3,150 +12.1% |
| 2017 | $225 +1.4% | $2,810 +12% |
| 2016 | $222 +1.1% | $2,510 +16.7% |
| 2015 | $219 +1.5% | $2,150 +33.1% |
| 2014 | $216 +2.5% | $1,615 -5% |
| 2013 | $211 +1.3% | $1,700 |
| 2012 | $208 -3.3% | $1,700 -20.9% |
| 2011 | $215 -5.3% | $2,150 -27.6% |
| 2010 | $227 -21.9% | $2,968 -56.1% |
| 2009 | $291 -18.1% | $6,759 -37.4% |
| 2008 | $355 +44.4% | $10,790 -25.1% |
| 2007 | $246 -43.2% | $14,400 -43.1% |
| 2006 | $433 +68.4% | $25,300 +91.7% |
| 2005 | $257 +284.2% | $13,200 +428% |
| 2004 | $67 +75.4% | $2,500 +150% |
| 2003 | $38 +4.2% | $1,000 +11.1% |
| 2002 | $37 -8.8% | $900 -18.2% |
| 2000 | $40 | $1,100 |
Find assessor info on the county website
Monthly payment
Est. payment
Payment breakdown
Explore the cost of this home by adjusting the details. Changes won't be saved.Climate risks
Neighborhood: 34434
- $217,7003 bd2 ba1.5k sqft5850 N Summerfield Point, Citrus Springs, FL 34434Off Market
- $237,1003 bd2 ba1.5k sqft5850 N Summerfield Pt, Citrus Springs, FL 34434Off Market
- $14,990-- bd-- ba-- sqft5826 N Bedstrow Blvd, Citrus Springs, FL 34434Off Market
- $16,360-- bd-- ba-- sqft5816 N Summerfield Point, Citrus Springs, FL 34434Off Market
Similar homes
- $419,9003 bd2 ba1.7k sqft5774 N Lamp Post Dr, Beverly Hills, FL 34465For Sale
 MLS ID #857519, Kirk Johnson, Citrus Ridge Realty. Realtors Association of Citrus County
- $425,0003 bd2 ba2.7k sqft365 W BARCLAY COURT, BEVERLY HILLS, FL 34465For Sale

 MLS ID #O6436431, Donna Mancauskas, EXIT GLOBAL REALTY. Stellar MLS
- $468,8504 bd3 ba2.2k sqft4981 N MULBERRY LOOP, BEVERLY HILLS, FL 34465New Construction
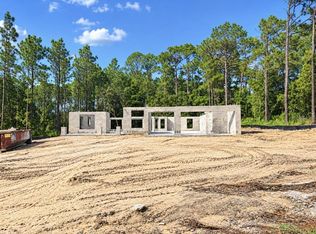 MLS ID #OM734544, Holly Dum, ADAMS HOMES REALTY INC. Stellar MLS
- $449,0003 bd2 ba2k sqft2168 W Begonia Dr, Beverly Hills, FL 34465For Sale
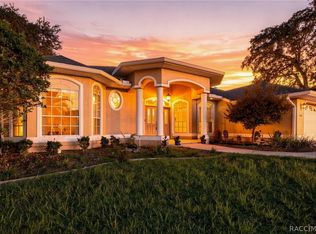 MLS ID #857317, Amy Meek, Meek Real Estate. Realtors Association of Citrus County
- $339,9004 bd2 ba1.7k sqft6065 N MATTHEW POINT, DUNNELLON, FL 34434New ConstructionMLS ID #O6445727, Janelle Cobb, INTEGRITY REALTY SERVICES LLC. Stellar MLS
- $358,9004 bd3 ba1.9k sqft5887 N BEDSTROW BOULEVARD, DUNNELLON, FL 34434New ConstructionStellar MLS
- $422,9004 bd3 ba2.4k sqft7987 N PRIMROSE DRIVE, DUNNELLON, FL 34434New ConstructionStellar MLS
- $432,9004 bd3 ba2.4k sqft1476 W DIAMOND DRIVE, CITRUS SPRINGS, FL 34434New ConstructionStellar MLS
- $303,8503 bd2 ba1.8k sqft2204 W RILEY DRIVE, CITRUS SPRINGS, FL 34434New ConstructionMLS ID #OM734461, Holly Dum, ADAMS HOMES REALTY INC. Stellar MLS
- $499,9003 bd2 ba1.8k sqft5042 N PEPPERMINT DRIVE, BEVERLY HILLS, FL 34465For SaleMLS ID #TB8528279, Valiyaveedan Thomas, PEOPLE'S CHOICE REALTY SVC LLC. Stellar MLS
