$301,900
-- bd|-- ba|-- sqft
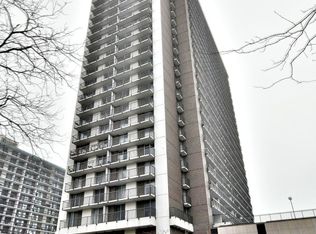
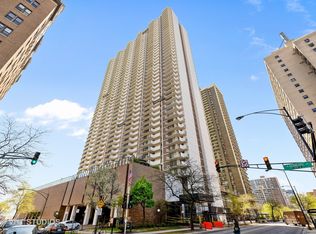
5855 N Sheridan Rd APT 4A, Chicago, IL 60660
Off Market
Zillow last checked:
Listing updated:
Megan Sullivan 312-733-7201,
Compass
Not available
Estimated sales range
Not available
Not available
| Date | Event | Price |
|---|---|---|
| 4/29/2022 | Sold | $410,000-3.5%$256/sqft |
Source: | ||
| 4/19/2022 | Pending sale | $425,000$266/sqft |
Source: | ||
| 3/28/2022 | Contingent | $425,000$266/sqft |
Source: | ||
| 3/8/2022 | Listed for sale | $425,000$266/sqft |
Source: | ||
| 3/8/2022 | Listing removed | -- |
Source: | ||
| 3/2/2022 | Contingent | $425,000$266/sqft |
Source: | ||
| 2/18/2022 | Listed for sale | $425,000+41.7%$266/sqft |
Source: | ||
| 4/11/2018 | Sold | $299,900-7.7%$187/sqft |
Source: | ||
| 2/23/2018 | Listed for sale | $324,900+25.2%$203/sqft |
Source: Kale Realty #09864653 Report a problem | ||
| 4/30/2015 | Sold | $259,500-3.9%$162/sqft |
Source: @Properties sold #08852064_60660_24J Report a problem | ||
| 3/26/2015 | Pending sale | $269,900$169/sqft |
Source: RE/MAX Edge #08852064 Report a problem | ||
| 3/24/2015 | Price change | $269,900-5.3%$169/sqft |
Source: RE/MAX Edge #08852064 Report a problem | ||
| 3/9/2015 | Price change | $285,000-4.7%$178/sqft |
Source: RE/MAX Edge #08852064 Report a problem | ||
| 3/5/2015 | Listed for sale | $299,000+92.9%$187/sqft |
Source: RE/MAX Edge #08852064 Report a problem | ||
| 1/31/2013 | Sold | $155,000-11.4%$97/sqft |
Source: Agent Provided Report a problem | ||
| 1/6/2013 | Pending sale | $175,000$109/sqft |
Source: Sudler Commercial #08005285 Report a problem | ||
| 12/19/2012 | Price change | $175,000-7.9%$109/sqft |
Source: Sudler Commercial #08005285 Report a problem | ||
| 11/15/2012 | Price change | $190,000-13.2%$119/sqft |
Source: Sudler Commercial #08005285 Report a problem | ||
| 8/31/2012 | Pending sale | $219,000$137/sqft |
Source: Sudler Commercial #08005285 Report a problem | ||
| 6/13/2012 | Listed for sale | $219,000+177.2%$137/sqft |
Source: Sudler Commercial #08005285 Report a problem | ||
| 10/5/1993 | Sold | $79,000$49/sqft |
Source: Public Record Report a problem | ||
| Year | Property taxes | Tax assessment |
|---|---|---|
| 2024 | -- | $33,708 +18.6% |
| 2023 | $5,995 +2.6% | $28,415 |
| 2022 | $5,844 +2.3% | $28,415 |
| 2021 | $5,714 +10.6% | $28,415 +22.5% |
| 2020 | $5,166 +0.2% | $23,189 -9.6% |
| 2019 | $5,155 +17.4% | $25,659 |
| 2018 | $4,390 +13.4% | $25,659 +20.1% |
| 2017 | $3,873 +2.5% | $21,365 |
| 2016 | $3,779 +10% | $21,365 |
| 2015 | $3,434 +19.2% | $21,365 +18% |
| 2014 | $2,882 -12.5% | $18,102 |
| 2013 | $3,292 +434.1% | $18,102 |
| 2012 | $616 -81.2% | $18,102 -10.4% |
| 2011 | $3,273 +470.3% | $20,198 -4.3% |
| 2010 | $574 +1.7% | $21,107 -13.6% |
| 2009 | $564 -3.5% | $24,434 -10.8% |
| 2008 | $585 -10.9% | $27,393 |
| 2007 | $656 -5.8% | $27,393 |
| 2006 | $697 -14.6% | $27,393 +16.8% |
| 2005 | $816 -4.8% | $23,454 |
| 2004 | $856 -9% | $23,454 |
| 2003 | $942 -11.6% | $23,454 +60.1% |
| 2002 | $1,065 -6.6% | $14,653 |
| 2001 | $1,140 -8.8% | $14,653 |
| 2000 | $1,250 -3.8% | $14,653 +35.2% |
| 1999 | $1,299 | $10,842 |
Find assessor info on the county website
Source: MRED as distributed by MLS GRID. This data may not be complete. We recommend contacting the local school district to confirm school assignments for this home.
A local agent can set up tours, give advice and negotiate with sellers.