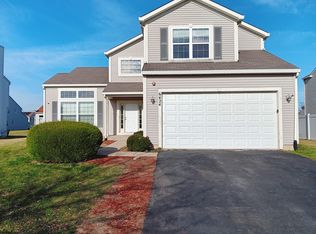
$355,000
4 bd|2 ba|2.4k sqft
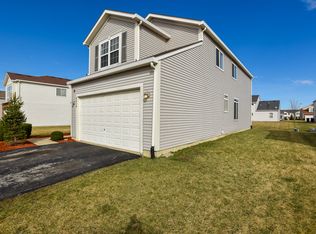
6504 Pasture Side Trl, Matteson, IL 60443
Sold
Zillow last checked:
Listing updated:
Maurice Hampton, CIPS 312-488-9467,
Centered International Realty
$368,200
$350,000 - $387,000
$3,747/mo
| Date | Event | Price |
|---|---|---|
| 6/26/2026 | Contingent | $375,000$119/sqft |
Source: | ||
| 6/19/2026 | Listed for sale | $375,000$119/sqft |
Source: | ||
| 5/20/2026 | Listing removed | $375,000$119/sqft |
Source: | ||
| 3/5/2026 | Contingent | $375,000$119/sqft |
Source: | ||
| 3/5/2026 | Listed for sale | $375,000$119/sqft |
Source: | ||
| 1/31/2026 | Contingent | $375,000$119/sqft |
Source: | ||
| 1/20/2026 | Listed for sale | $375,000$119/sqft |
Source: | ||
| 10/30/2025 | Listing removed | $375,000$119/sqft |
Source: | ||
| 9/8/2025 | Listed for sale | $375,000-16.6%$119/sqft |
Source: | ||
| 9/1/2025 | Listing removed | $449,900$143/sqft |
Source: | ||
| 7/10/2025 | Price change | $449,900-1.1%$143/sqft |
Source: | ||
| 6/24/2025 | Listed for sale | $455,000$145/sqft |
Source: | ||
| 6/24/2025 | Listing removed | $455,000$145/sqft |
Source: | ||
| 5/28/2025 | Price change | $455,000-1.1%$145/sqft |
Source: | ||
| 5/13/2025 | Listed for sale | $460,000$146/sqft |
Source: | ||
| 4/14/2025 | Contingent | $460,000$146/sqft |
Source: | ||
| 4/5/2025 | Listed for sale | $460,000+51.3%$146/sqft |
Source: | ||
| 1/12/2006 | Sold | $304,000$97/sqft |
Source: Public Record Report a problem | ||
| Year | Property taxes | Tax assessment |
|---|---|---|
| 2024 | -- | $33,000 +0% |
| 2023 | $12,305 +11.6% | $32,999 +37.4% |
| 2022 | $11,025 -1.4% | $24,012 |
| 2021 | $11,177 +2.4% | $24,012 |
| 2020 | $10,919 +2.4% | $24,012 +4.6% |
| 2019 | $10,665 +1.5% | $22,949 |
| 2018 | $10,507 +2.5% | $22,949 |
| 2017 | $10,248 +16.8% | $22,949 +17.9% |
| 2016 | $8,777 +2.6% | $19,457 |
| 2015 | $8,554 +14.9% | $19,457 |
| 2014 | $7,442 -30.8% | $19,457 -25.2% |
| 2013 | $10,760 +2.4% | $26,018 |
| 2012 | $10,507 +7.6% | $26,018 |
| 2011 | $9,761 +4.3% | $26,018 -5% |
| 2010 | $9,358 -9.9% | $27,397 -12.7% |
| 2009 | $10,386 +4.3% | $31,374 -5% |
| 2008 | $9,957 +14.1% | $33,026 +8.8% |
| 2007 | $8,725 -6% | $30,360 -7.7% |
| 2006 | $9,277 | $32,875 |
Find assessor info on the county website
Source: MRED as distributed by MLS GRID. This data may not be complete. We recommend contacting the local school district to confirm school assignments for this home.
A local agent can set up tours, give advice and negotiate with sellers.