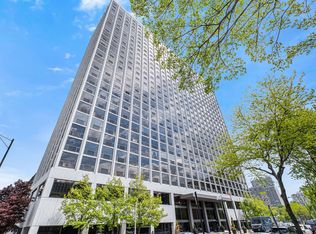
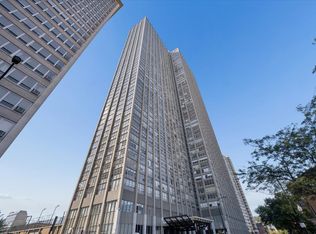
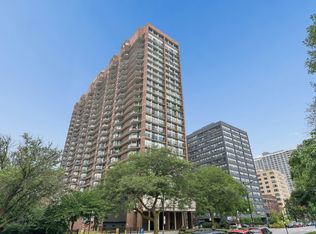
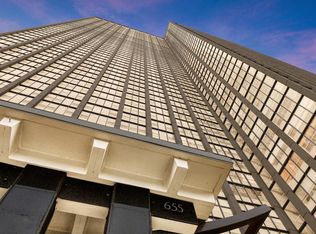
$253,700
-- bd-- ba-- sqft
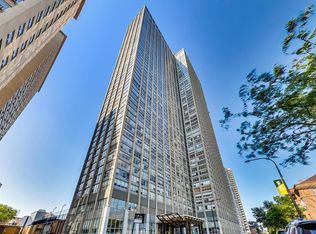
655 W Irving Park Rd APT 1316, Chicago, IL 60613
Off Market
Listing description withheld by the listing agent.
Zillow last checked:
Listing updated:
Kim Martorano 312-520-2346,
@properties Christie's International Real Estate

Not available
Estimated sales range
Not available
Not available
| Date | Event | Price |
|---|---|---|
| 3/10/2023 | Listing removed | -- |
Source:  MRED as distributed by MLS GRID #11164283 Report a problem | ||
| 10/27/2021 | Listing removed | $299,900$261/sqft |
Source: MRED as distributed by MLS GRID #11164283 Report a problem | ||
| 8/20/2021 | Price change | $299,900-3.3%$261/sqft |
Source: MRED as distributed by MLS GRID #11164283 Report a problem | ||
| 7/22/2021 | Listed for sale | $310,000+17.9%$270/sqft |
Source: MRED as distributed by MLS GRID #11164283 Report a problem | ||
| 8/14/2019 | Listing removed | $2,350$2/sqft |
Source: Richland Global Inc #10467231 Report a problem | ||
| 7/29/2019 | Listed for rent | $2,350+2.2%$2/sqft |
Source: Richland Global Inc #10467231 Report a problem | ||
| 8/29/2018 | Listing removed | $2,300$2/sqft |
Source: Richland Global Inc #10039508 Report a problem | ||
| 8/3/2018 | Listed for rent | $2,300$2/sqft |
Source: Richland Global Inc #10039508 Report a problem | ||
| 8/1/2018 | Sold | $262,888+1.1%$229/sqft |
Source: MRED as distributed by MLS GRID #09982685 Report a problem | ||
| 6/18/2018 | Pending sale | $260,000$226/sqft |
Source: @properties #09982685 Report a problem | ||
| 6/12/2018 | Price change | $260,000-3.7%$226/sqft |
Source: @properties #09982685 Report a problem | ||
| 5/10/2018 | Listed for sale | $269,900-7.7%$235/sqft |
Source: @properties #09982685 Report a problem | ||
| 6/14/2007 | Sold | $292,500$254/sqft |
Source: MRED as distributed by MLS GRID #06357302 Report a problem | ||
| Year | Property taxes | Tax assessment |
|---|---|---|
| 2024 | $4,750 +0.1% | $23,944 +6.4% |
| 2023 | $4,747 +2.6% | $22,499 |
| 2022 | $4,628 +2.3% | $22,499 |
| 2021 | $4,524 +6.1% | $22,499 +17.5% |
| 2020 | $4,265 +0.6% | $19,147 -9.3% |
| 2019 | $4,240 +1.7% | $21,103 |
| 2018 | $4,169 +6.8% | $21,103 +16.4% |
| 2017 | $3,903 +7.5% | $18,129 |
| 2016 | $3,631 -1.7% | $18,129 -10.1% |
| 2015 | $3,695 +33.1% | $20,162 +34.8% |
| 2014 | $2,775 +2% | $14,957 |
| 2013 | $2,720 +1.4% | $14,957 |
| 2012 | $2,684 -4.5% | $14,957 -13.8% |
| 2011 | $2,811 -16.5% | $17,345 -16.1% |
| 2010 | $3,364 -7.1% | $20,674 -11% |
| 2009 | $3,622 +9.6% | $23,229 +0.9% |
| 2008 | $3,304 +1% | $23,031 |
| 2007 | $3,271 +7.6% | $23,031 |
| 2006 | $3,041 | $23,031 |
Source: MRED as distributed by MLS GRID. This data may not be complete. We recommend contacting the local school district to confirm school assignments for this home.

A local agent can set up tours, give advice and negotiate with sellers.