$--
3 bd|1 ba|1k sqft
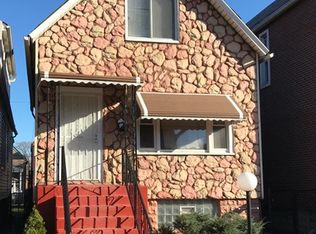
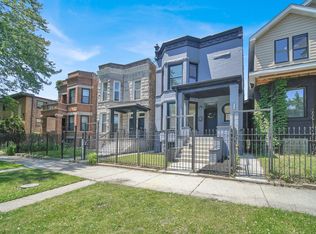
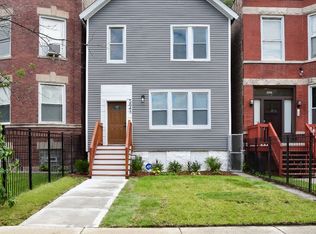
6817 S Champlain Ave #1, Chicago, IL 60637
Off Market
Zillow last checked:
Listing updated:
Ismail Madina 773-853-4963,
Northpoint Realty & Asset Mgmt
$688,900
$654,000 - $723,000
$3,642/mo
| Date | Event | Price |
|---|---|---|
| 8/14/2025 | Listed for sale | $703,000+326.1%$117/sqft |
Source: | ||
| 7/5/2023 | Sold | $165,000-34%$28/sqft |
Source: | ||
| 12/13/2021 | Listing removed | -- |
Source: | ||
| 11/20/2021 | Listed for sale | $250,000+187.4%$42/sqft |
Source: | ||
| 10/24/2018 | Sold | $87,000+365.3%$15/sqft |
Source: Public Record Report a problem | ||
| 8/15/2011 | Sold | $18,699-88.3%$3/sqft |
Source: | ||
| 2/4/2011 | Listing removed | $159,900$27/sqft |
Source: Classic Realty Group #07481005 Report a problem | ||
| 10/2/2010 | Listed for sale | $159,900$27/sqft |
Source: Classic Realty Group #07481005 Report a problem | ||
| 8/19/2010 | Listing removed | $159,900$27/sqft |
Source: Classic Realty Group #07481005 Report a problem | ||
| 4/5/2010 | Listed for sale | $159,900+146%$27/sqft |
Source: Classic Realty Group #07481005 Report a problem | ||
| 8/17/1995 | Sold | $65,000$11/sqft |
Source: Public Record Report a problem | ||
| Year | Property taxes | Tax assessment |
|---|---|---|
| 2024 | -- | $19,001 +46.2% |
| 2023 | $2,752 +2.9% | $12,999 |
| 2022 | $2,674 +2.3% | $12,999 |
| 2021 | $2,614 -14.4% | $12,999 -5.1% |
| 2020 | $3,052 -2.4% | $13,702 -12% |
| 2019 | $3,128 +1.7% | $15,571 |
| 2018 | $3,076 -23.4% | $15,571 -16.5% |
| 2017 | $4,017 +7.5% | $18,658 |
| 2016 | $3,737 +9.3% | $18,658 |
| 2015 | $3,419 +15.9% | $18,658 +17.4% |
| 2014 | $2,950 +2% | $15,899 |
| 2013 | $2,892 +1.4% | $15,899 |
| 2012 | $2,853 -12.2% | $15,899 -20.8% |
| 2011 | $3,251 -0.4% | $20,062 |
| 2010 | $3,265 +4.4% | $20,062 |
| 2009 | $3,128 -5.9% | $20,062 -13.4% |
| 2008 | $3,324 +1% | $23,170 |
| 2007 | $3,291 -1.1% | $23,170 |
| 2006 | $3,326 +56.8% | $23,170 +78.5% |
| 2005 | $2,121 +1% | $12,980 |
| 2004 | $2,100 +2.2% | $12,980 |
| 2003 | $2,054 +25.7% | $12,980 +42.8% |
| 2002 | $1,633 +3.8% | $9,092 |
| 2001 | $1,574 +36% | $9,092 |
| 2000 | $1,157 -0.7% | $9,092 +50.9% |
| 1999 | $1,165 | $6,024 |
Find assessor info on the county website
Source: MRED as distributed by MLS GRID. This data may not be complete. We recommend contacting the local school district to confirm school assignments for this home.
A local agent can set up tours, give advice and negotiate with sellers.
A local lender can help you make sure your offer is ready when you are.