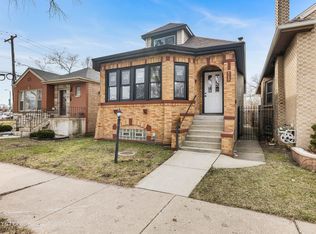
$279,800
6 bd|2 ba|2.2k sqft
6826 S Michigan Ave, Chicago, IL 60637
Off Market
Zillow last checked:
Listing updated:
Emory Brown 708-932-6866,
TADD Realty
Not available
Estimated sales range
Not available
Not available
| Date | Event | Price |
|---|---|---|
| 6/3/2026 | Price change | $375,000-3.6% |
Source: | ||
| 5/10/2026 | Listed for sale | $389,000 |
Source: | ||
| 4/24/2026 | Pending sale | $389,000 |
Source: | ||
| 1/9/2026 | Listed for sale | $389,000+44.1% |
Source: | ||
| 8/17/2025 | Listing removed | $270,000 |
Source: | ||
| 8/15/2025 | Listed for sale | $270,000-28% |
Source: | ||
| 8/8/2025 | Listing removed | $375,000 |
Source: | ||
| 6/4/2025 | Price change | $375,000-1.3% |
Source: | ||
| 1/20/2025 | Price change | $380,000-2.3% |
Source: | ||
| 10/3/2024 | Listed for sale | $389,000 |
Source: | ||
| 9/11/2024 | Listing removed | $389,000 |
Source: | ||
| 9/6/2024 | Listed for sale | $389,000+168.3% |
Source: | ||
| 8/23/2022 | Sold | $145,000-3.3% |
Source: | ||
| 5/19/2022 | Contingent | $149,999 |
Source: | ||
| 3/2/2022 | Listed for sale | $149,999-39.1% |
Source: | ||
| 5/21/2012 | Listing removed | $1,250 |
Source: Kelly Enterprises, Inc. Report a problem | ||
| 5/21/2012 | Price change | $1,250-13.8% |
Source: Kelly Enterprises, Inc. Report a problem | ||
| 5/9/2012 | Listed for rent | $1,450 |
Source: Kelly Enterprises, Inc. Report a problem | ||
| 4/4/2006 | Sold | $246,500+228.7% |
Source: Public Record Report a problem | ||
| 3/5/1996 | Sold | $75,000 |
Source: Public Record Report a problem | ||
| Year | Property taxes | Tax assessment |
|---|---|---|
| 2024 | -- | $20,000 +66.7% |
| 2023 | $2,532 +2.6% | $12,000 |
| 2022 | $2,468 +2.3% | $12,000 |
| 2021 | $2,413 -21.4% | $12,000 -12.9% |
| 2020 | $3,069 -2.4% | $13,776 -12% |
| 2019 | $3,145 +1.7% | $15,655 |
| 2018 | $3,092 -22.6% | $15,655 -15.6% |
| 2017 | $3,995 +7.5% | $18,556 |
| 2016 | $3,717 +9.3% | $18,556 |
| 2015 | $3,400 +15.3% | $18,556 +16.8% |
| 2014 | $2,949 +2% | $15,892 |
| 2013 | $2,890 +1.4% | $15,892 |
| 2012 | $2,852 -13.3% | $15,892 -21.7% |
| 2011 | $3,288 -0.4% | $20,292 |
| 2010 | $3,302 +4.4% | $20,292 |
| 2009 | $3,164 -11.1% | $20,292 -18.2% |
| 2008 | $3,560 +1% | $24,817 |
| 2007 | $3,525 -1.1% | $24,817 |
| 2006 | $3,563 +139.2% | $24,817 +95.1% |
| 2005 | $1,490 +1.9% | $12,718 |
| 2004 | $1,462 +4.5% | $12,718 |
| 2003 | $1,399 -5.4% | $12,718 +26.5% |
| 2002 | $1,479 +6.3% | $10,057 |
| 2001 | $1,391 +0.1% | $10,057 |
| 2000 | $1,390 | $10,057 +39% |
| 1999 | $1,390 | $7,234 |
Find assessor info on the county website
Source: MRED as distributed by MLS GRID. This data may not be complete. We recommend contacting the local school district to confirm school assignments for this home.
A local agent can set up tours, give advice and negotiate with sellers.
A local lender can help you make sure your offer is ready when you are.