$255,000
2 bd|1 ba|1.4k sqft
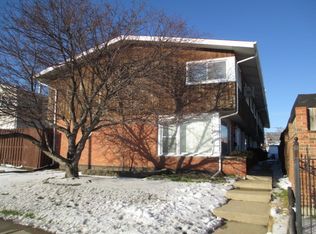
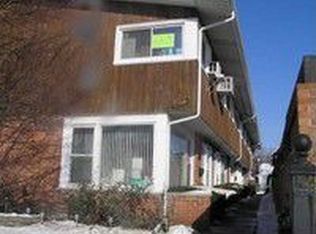
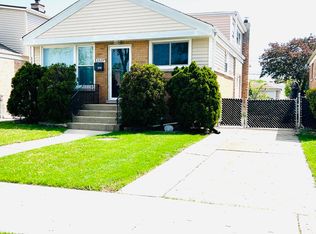
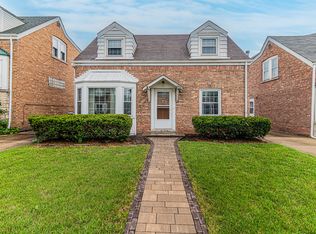
7803 W Victoria St, Chicago, IL 60631
Sold
Likely to sell faster than
Zillow last checked:
Listing updated:
Judi Rentas 773-367-6865,
Need-A-Home Real Estate LLC
Not available
Estimated sales range
Not available
Not available
| Date | Event | Price |
|---|---|---|
| 5/5/2026 | Listing removed | $449,950$442/sqft |
Source: | ||
| 3/31/2026 | Listed for sale | $449,950+26.7%$442/sqft |
Source: | ||
| 7/18/2023 | Sold | $355,000+1.5%$348/sqft |
Source: | ||
| 6/14/2023 | Contingent | $349,900$343/sqft |
Source: | ||
| 6/8/2023 | Listed for sale | $349,9000%$343/sqft |
Source: | ||
| 7/16/2022 | Listing removed | -- |
Source: | ||
| 6/24/2022 | Listed for sale | $350,000+6.7%$343/sqft |
Source: | ||
| 6/18/2019 | Sold | $328,000+1.2%$322/sqft |
Source: | ||
| 5/22/2019 | Pending sale | $324,000$318/sqft |
Source: Jameson Sotheby's International Realty #10384000 Report a problem | ||
| 5/17/2019 | Listed for sale | $324,000+58%$318/sqft |
Source: Jameson Sothebys Intl Realty #10384000 Report a problem | ||
| 4/8/2014 | Listing removed | $600$1/sqft |
Source: Zillow Rental Network Report a problem | ||
| 2/10/2014 | Price change | $600-63.6%$1/sqft |
Source: Zillow Rental Network Report a problem | ||
| 1/19/2014 | Listed for rent | $1,650$2/sqft |
Source: The Landview Group, Inc. #08519673 Report a problem | ||
| 2/15/2013 | Listing removed | $1,650$2/sqft |
Source: The Landview Group Inc #08252046 Report a problem | ||
| 1/18/2013 | Listed for rent | $1,650$2/sqft |
Source: The Landview Group Inc #08252046 Report a problem | ||
| 6/18/1999 | Sold | $205,000$201/sqft |
Source: Public Record Report a problem | ||
| Year | Property taxes | Tax assessment |
|---|---|---|
| 2024 | -- | $32,001 +20% |
| 2023 | $5,625 +2.6% | $26,662 |
| 2022 | $5,484 +2.3% | $26,662 |
| 2021 | $5,361 +14.1% | $26,662 +26.4% |
| 2020 | $4,697 +0.9% | $21,086 -9% |
| 2019 | $4,656 +1.7% | $23,172 |
| 2018 | $4,577 +2.4% | $23,172 +11.6% |
| 2017 | $4,469 +7.5% | $20,758 |
| 2016 | $4,158 +3.8% | $20,758 -5% |
| 2015 | $4,004 +12.5% | $21,851 +13.9% |
| 2014 | $3,559 +18.2% | $19,180 |
| 2013 | $3,010 +0.5% | $19,180 |
| 2012 | $2,994 -24.5% | $19,180 -27.6% |
| 2011 | $3,965 +14.5% | $26,491 |
| 2010 | $3,463 +8% | $26,491 |
| 2009 | $3,205 +0.4% | $26,491 -8.6% |
| 2008 | $3,193 +11.5% | $28,975 |
| 2007 | $2,863 +0.8% | $28,975 |
| 2006 | $2,841 -5.1% | $28,975 +29.2% |
| 2005 | $2,995 +1.9% | $22,426 |
| 2004 | $2,939 +4.5% | $22,426 |
| 2003 | $2,814 -5.4% | $22,426 +22% |
| 2002 | $2,975 +5% | $18,380 |
| 2001 | $2,832 +13% | $18,380 |
| 2000 | $2,507 -0.2% | $18,380 +22.1% |
| 1999 | $2,511 | $15,049 |
Find assessor info on the county website
Source: MRED as distributed by MLS GRID. This data may not be complete. We recommend contacting the local school district to confirm school assignments for this home.
A local agent can set up tours, give advice and negotiate with sellers.