$169,200
9,814 Square Feet
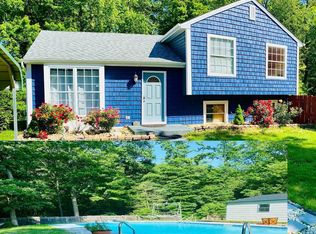
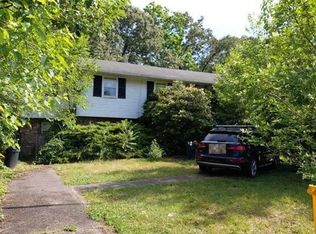
7835 Leymar Rd, Glen Burnie, MD 21060
Off Market
Zillow last checked:
Listing updated:
Pasquale Carannante 301-807-3265,
RE/Max Experience (301) 807-3265
$555,400
$522,000 - $589,000
$2,820/mo
| Date | Event | Price |
|---|---|---|
| 12/6/2017 | Sold | $355,000-1.4%$224/sqft |
Source: Public Record Report a problem | ||
| 9/22/2017 | Price change | $359,900-1.4%$227/sqft |
Source: Better Choice Real Estate #AA10014830 Report a problem | ||
| 9/13/2017 | Price change | $364,900-2.7%$230/sqft |
Source: Better Choice Real Estate #AA10014830 Report a problem | ||
| 8/27/2017 | Listed for sale | $374,900$237/sqft |
Source: Better Choice Real Estate #AA10014830 Report a problem | ||
| 8/14/2017 | Pending sale | $374,900$237/sqft |
Source: Better Choice Real Estate #AA10014830 Report a problem | ||
| 8/9/2017 | Listed for sale | $374,900$237/sqft |
Source: Better Choice Real Estate #AA10014830 Report a problem | ||
| 8/9/2017 | Pending sale | $374,900$237/sqft |
Source: Better Choice Real Estate #AA10014830 Report a problem | ||
| 7/26/2017 | Listed for sale | $374,900+134.3%$237/sqft |
Source: Better Choice Real Estate #AA10014830 Report a problem | ||
| 1/19/2017 | Sold | $160,000-31.2%$101/sqft |
Source: Public Record Report a problem | ||
| 10/20/2016 | Sold | $232,700$147/sqft |
Source: Public Record Report a problem | ||
| Year | Property taxes | Tax assessment |
|---|---|---|
| 2025 | $4,024 -9.7% | $433,100 +6.4% |
| 2024 | $4,457 +7.1% | $407,067 +6.8% |
| 2023 | $4,161 +12.2% | $381,033 +7.3% |
| 2022 | $3,710 +8.2% | $355,000 +8.2% |
| 2021 | $3,428 +8.9% | $328,000 +9% |
| 2020 | $3,148 +9.7% | $301,000 +9.9% |
| 2019 | $2,869 +3.5% | $274,000 +0.2% |
| 2018 | $2,773 -0.3% | $273,467 +0.2% |
| 2017 | $2,782 | $272,933 +0.2% |
| 2016 | -- | $272,400 |
| 2015 | -- | $272,400 |
| 2014 | -- | $272,400 -4.6% |
| 2013 | -- | $285,500 |
| 2012 | -- | $285,500 |
| 2011 | -- | $285,500 -25.4% |
| 2010 | -- | $382,530 +10.3% |
| 2009 | -- | $346,900 +11.4% |
| 2008 | -- | $311,270 +12.9% |
| 2007 | -- | $275,640 +14.5% |
| 2006 | -- | $240,630 +17% |
| 2005 | -- | $205,620 +20.5% |
| 2004 | -- | $170,610 +5% |
| 2003 | -- | $162,550 +5.2% |
| 2002 | -- | $154,490 +5.5% |
| 2001 | -- | $146,430 |
Find assessor info on the county website
Source: Bright MLS. This data may not be complete. We recommend contacting the local school district to confirm school assignments for this home.
A local agent can set up tours, give advice and negotiate with sellers.