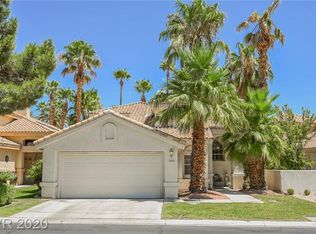
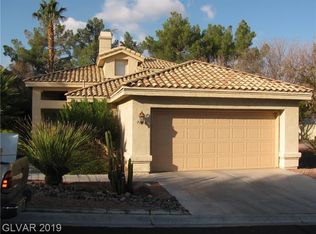
This 1799 square foot single family home has 3 bedrooms and 3.0 bathrooms. This home is located at 7844 Sea Rock Rd, Las Vegas, NV 89128.
Foreclosed
Est. $515,000
7844 Sea Rock Rd, Las Vegas, NV 89128
3beds
3baths
1,799sqft
SingleFamily
Built in 1990
4,791 Square Feet Lot
$515,000 Zestimate®
$286/sqft
$83/mo HOA
Overview
- 255 days |
- 49 |
- 0 |
Facts & features
Interior
Bedrooms & bathrooms
- Bedrooms: 3
- Bathrooms: 3
Heating
- Forced air
Cooling
- Central
Features
- Flooring: Carpet, Concrete, Linoleum / Vinyl
- Has fireplace: Yes
Interior area
- Total interior livable area: 1,799 sqft
Property
Parking
- Parking features: Garage - Attached
Features
- Exterior features: Stucco
Lot
- Size: 4,791 Square Feet
Details
- Parcel number: 13816713028
Construction
Type & style
- Home type: SingleFamily
Materials
- Frame
- Roof: Other
Condition
- Year built: 1990
Community & HOA
HOA
- Has HOA: Yes
- HOA fee: $83 monthly
Location
- Region: Las Vegas
Financial & listing details
- Price per square foot: $286/sqft
- Tax assessed value: $302,671
- Annual tax amount: $2,876
Visit our professional directory to find a foreclosure specialist in your area that can help with your home search.
Find a foreclosure agentForeclosure details
Estimated market value
$515,000
$489,000 - $541,000
$2,227/mo
Price history
| Date | Event | Price |
|---|---|---|
| 10/14/2025 | Sold | $390,000+136.4%$217/sqft |
Source: Public Record Report a problem | ||
| 10/24/1994 | Sold | $165,000$92/sqft |
Source: Public Record Report a problem | ||
Public tax history
| Year | Property taxes | Tax assessment |
|---|---|---|
| 2025 | $2,876 +8% | $105,935 +18.6% |
| 2024 | $2,664 +8% | $89,307 +10.9% |
| 2023 | $2,467 +8% | $80,549 +5.3% |
| 2022 | $2,284 +7.7% | $76,478 -4.9% |
| 2021 | $2,120 +6.7% | $80,457 +15% |
| 2020 | $1,987 +4.8% | $69,945 +8.6% |
| 2019 | $1,896 +6.9% | $64,401 |
| 2018 | $1,773 | $64,401 +5.1% |
| 2017 | $1,773 | $61,289 +4% |
| 2016 | $1,773 +0.2% | $58,946 +3.7% |
| 2015 | $1,769 +3.2% | $56,866 +14.6% |
| 2014 | $1,714 | $49,639 |
| 2013 | -- | $49,639 +3.2% |
| 2012 | -- | $48,104 -6.5% |
| 2011 | -- | $51,459 -0.9% |
| 2010 | -- | $51,940 -21.3% |
| 2009 | -- | $65,969 |
| 2008 | -- | $65,969 -39.9% |
| 2007 | -- | $109,741 -3.5% |
| 2006 | -- | $113,721 +34.9% |
| 2005 | -- | $84,287 +46.2% |
| 2004 | -- | $57,638 +10.5% |
| 2003 | -- | $52,147 -0.3% |
| 2002 | -- | $52,330 +7% |
| 2001 | -- | $48,920 |
Find assessor info on the county website
Monthly payment
Estimated monthly payment$1,822
All calculations are estimates and provided by Zillow, Inc. for informational purposes only. Actual amounts may vary.
HOA fees may include property taxes on listings classified as Co-Ops. Contact the listing agent and/or owner for fee details.
Mortgage interest rates are dependent on a number of factors, including credit score, down payment, and repayment length. Interest rate data provided by Zillow Group Marketplace, Inc. as of 1/1/1970 from various mortgage lenders with which we have lead or other similar arrangements; the Estimated Payment is an average of those rates.
See how much you could borrow to make a competitive offer.
Climate risks
Neighborhood: Desert Shores
Nearby schools
GreatSchools rating
- 6/10Dorothy Eisenberg Elementary SchoolGrades: PK-5Distance: 1.2 mi
- 6/10Ernest Becker Middle SchoolGrades: 6-8Distance: 1.7 mi
- 3/10Cimarron Memorial High SchoolGrades: 9-12Distance: 0.8 mi


- Nevada
- Clark County
- Las Vegas
- 89128
- Desert Shores
- 7844 Sea Rock Rd
Nearby cities
Nearby neighborhoods
Nearby zip codes
Other Las Vegas Topics
