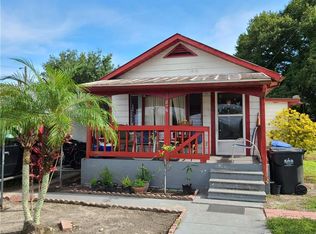
This has been a great home, but now needs some TLC... carpet replaced, interior painted, update kitchen. At this price for this size home, it's an excellent investment. It has a fenced yard and a storage shed. The Bonus Room has been a child's bedroom for the last nine years, so it's like having three bedrooms (just one without a closet). Not only is there no HOA or CDD, but it has the BEST zoning... PDMU! That means you can do almost anything... it's like Commercial and Residential all wrapped into one! The NEW ROOF is less than three years old, as is the exterior paint. The owner is a Realtor. COME check it out! :)
Foreclosed
Est. $221,500
806 W Shell Point Rd, Ruskin, FL 33570
2beds
1,657sqft
SingleFamily
Built in 1961
10,798 Square Feet Lot
$221,500 Zestimate®
$134/sqft
$-- HOA
Overview
- 148 days |
- 58 |
- 1 |
Facts & features
Interior
Bedrooms & bathrooms
- Bedrooms: 2
- Bathrooms: 1
- Full bathrooms: 1
Heating
- Other
Cooling
- Central
Appliances
- Laundry: Inside
Features
- Ceiling Fans(s), Unfurnished
- Flooring: Tile, Concrete, Hardwood, Linoleum / Vinyl
Interior area
- Structure area source: Public Records
- Total interior livable area: 1,657 sqft
Property
Features
- Exterior features: Wood, Cement / Concrete
Lot
- Size: 10,798 Square Feet
Details
- Parcel number: 1932071V5000000001250U
- Zoning: PD
Construction
Type & style
- Home type: SingleFamily
Materials
- masonry
- Roof: Composition
Condition
- Year built: 1961
Utilities & green energy
- Utilities for property: Public, Cable Connected
Community & HOA
Location
- Region: Ruskin
Financial & listing details
- Price per square foot: $134/sqft
- Tax assessed value: $230,961
- Annual tax amount: $4,813
Visit our professional directory to find a foreclosure specialist in your area that can help with your home search.
Find a foreclosure agentForeclosure details
Estimated market value
$221,500
$186,000 - $255,000
$1,699/mo
Price history
| Date | Event | Price |
|---|---|---|
| 1/23/2026 | Sold | $132,200-57.4%$80/sqft |
Source: Public Record Report a problem | ||
| 4/6/2022 | Sold | $310,000+5.1%$187/sqft |
Source: Public Record Report a problem | ||
| 2/24/2022 | Pending sale | $295,000$178/sqft |
Source: | ||
| 2/21/2022 | Listed for sale | $295,000+145.8%$178/sqft |
Source: | ||
| 6/18/2018 | Sold | $120,000-7%$72/sqft |
Source: Public Record Report a problem | ||
| 5/6/2018 | Price change | $129,000-7.8%$78/sqft |
Source: YOUR HOMETOWN REALTY, INC. #T3101916 Report a problem | ||
| 4/19/2018 | Listed for sale | $139,900+39.9%$84/sqft |
Source: YOUR HOMETOWN REALTY, INC. #T3101916 Report a problem | ||
| 10/2/2008 | Sold | $100,000+28.2%$60/sqft |
Source: Stellar MLS #T2294376 Report a problem | ||
| 1/4/2001 | Sold | $78,000+178.6%$47/sqft |
Source: Public Record Report a problem | ||
| 11/10/1999 | Sold | $28,000+55.6%$17/sqft |
Source: Public Record Report a problem | ||
| 10/12/1998 | Sold | $18,000-25%$11/sqft |
Source: Public Record Report a problem | ||
| 8/12/1997 | Sold | $24,000-61.5%$14/sqft |
Source: Public Record Report a problem | ||
| 8/29/1995 | Sold | $62,400$38/sqft |
Source: Public Record Report a problem | ||
Public tax history
| Year | Property taxes | Tax assessment |
|---|---|---|
| 2025 | $4,813 +5.3% | $230,961 |
| 2024 | $4,568 +8.5% | $230,961 +8.9% |
| 2023 | $4,211 +37.6% | $212,014 +52.1% |
| 2022 | $3,060 +12.2% | $139,383 +10% |
| 2021 | $2,727 +11.6% | $126,712 +10% |
| 2020 | $2,444 +4.6% | $115,193 +3.6% |
| 2019 | $2,337 | $111,219 +7.1% |
| 2018 | $2,337 +37.1% | $103,890 +20.4% |
| 2017 | $1,705 +9.1% | $86,315 +32.6% |
| 2016 | $1,562 +10.1% | $65,110 +10% |
| 2015 | $1,419 | $59,191 -2.1% |
| 2014 | $1,419 | $60,451 +3% |
| 2013 | $1,419 +5.6% | $58,709 +7.8% |
| 2012 | $1,344 -59.4% | $54,486 -61.8% |
| 2006 | $3,311 +155.1% | $142,680 +92.8% |
| 2005 | $1,298 | $73,992 +3% |
| 2004 | -- | $71,837 +1.9% |
| 2003 | -- | $70,498 +2.4% |
| 2002 | -- | $68,846 +1.6% |
| 2001 | -- | $67,762 +14.6% |
| 2000 | $833 | $59,121 |
Find assessor info on the county website
Monthly payment
Estimated monthly payment$1,822
All calculations are estimates and provided by Zillow, Inc. for informational purposes only. Actual amounts may vary.
HOA fees may include property taxes on listings classified as Co-Ops. Contact the listing agent and/or owner for fee details.
Mortgage interest rates are dependent on a number of factors, including credit score, down payment, and repayment length. Interest rate data provided by Zillow Group Marketplace, Inc. as of 1/1/1970 from various mortgage lenders with which we have lead or other similar arrangements; the Estimated Payment is an average of those rates.
See how much you could borrow to make a competitive offer.
Climate risks
Neighborhood: 33570
Nearby schools
GreatSchools rating
- 2/10Thompson ElementaryGrades: PK-5Distance: 2.3 mi
- 2/10Shields Middle SchoolGrades: 6-8Distance: 4.8 mi
- 3/10Lennard High SchoolGrades: 9-12Distance: 2.3 mi


- Florida
- Hillsborough County
- Ruskin
- 33570
- 806 W Shell Point Rd
Nearby cities
Nearby zip codes
Other Ruskin Topics
