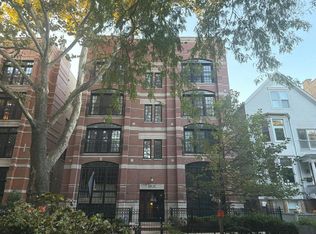
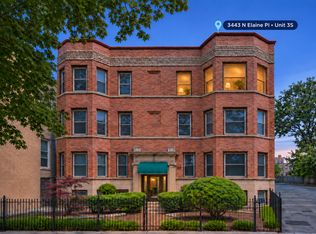
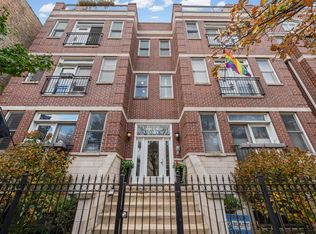
$688,500
2 bd2 ba1.6k sqft
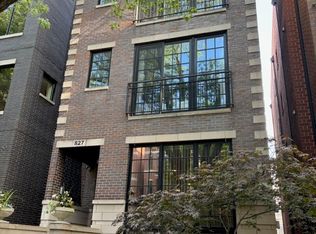
827 W Buckingham Pl APT 3, Chicago, IL 60657
Off Market

Listing description withheld by the listing agent.
Zillow last checked:
Listing updated:
Brandon Loncar 630-918-1150,
Loncar Realty,
Gabriela Loncar,
Loncar Realty

$661,800
$629,000 - $695,000
$4,279/mo
| Date | Event | Price |
|---|---|---|
| 11/6/2026 | Listed for sale | $650,000+23.8%$406/sqft |
Source:  MRED as distributed by MLS GRID #12801923 Report a problem | ||
| 5/3/2022 | Sold | $525,000+5%$328/sqft |
Source: MRED as distributed by MLS GRID #11325293 Report a problem | ||
| 8/11/2017 | Sold | $500,000+0%$313/sqft |
Source: MRED as distributed by MLS GRID #09649883 Report a problem | ||
| 6/26/2017 | Pending sale | $499,900$312/sqft |
Source: Coldwell Banker Residential Brokerage - Lincoln Park Plaza #09649883 Report a problem | ||
| 6/20/2017 | Price change | $499,900-2.9%$312/sqft |
Source: Coldwell Banker Residential Brokerage - Lincoln Park Plaza #09649883 Report a problem | ||
| 6/6/2017 | Price change | $514,900-1.9%$322/sqft |
Source: Coldwell Banker Residential Brokerage - Lincoln Park Plaza #09649883 Report a problem | ||
| 5/23/2017 | Price change | $524,900-1.9%$328/sqft |
Source: Exit Strategy Realty #09636882 Report a problem | ||
| 5/17/2017 | Price change | $534,900-2.7%$334/sqft |
Source: Exit Strategy Realty #09636882 Report a problem | ||
| 5/12/2017 | Listed for sale | $549,900+21.3%$344/sqft |
Source: Exit Strategy Realty #09636882 Report a problem | ||
| 6/26/2013 | Sold | $453,500+0.8%$283/sqft |
Source: Public Record Report a problem | ||
| 4/21/2013 | Pending sale | $450,000$281/sqft |
Source: Koenig & Strey Real Living #08311397 Report a problem | ||
| 4/9/2013 | Listed for sale | $450,000-5.3%$281/sqft |
Source: Koenig & Strey Real Living #08311397 Report a problem | ||
| 6/5/2006 | Sold | $475,000$297/sqft |
Source: Public Record Report a problem | ||
| Year | Property taxes | Tax assessment |
|---|---|---|
| 2024 | $10,584 -2.3% | $52,683 +2.6% |
| 2023 | $10,829 +9.9% | $51,326 |
| 2022 | $9,853 +2.1% | $51,326 |
| 2021 | $9,652 +5.9% | $51,326 +25.5% |
| 2020 | $9,114 +1.8% | $40,911 -8.2% |
| 2019 | $8,954 +1.7% | $44,566 |
| 2018 | $8,803 +3.2% | $44,566 +12.4% |
| 2017 | $8,532 +7.5% | $39,634 |
| 2016 | $7,938 +9.3% | $39,634 |
| 2015 | $7,263 -2% | $39,634 -0.8% |
| 2014 | $7,414 +9.2% | $39,962 |
| 2013 | $6,790 +1% | $39,962 |
| 2012 | $6,723 -8.6% | $39,962 -15.7% |
| 2011 | $7,358 -0.9% | $47,428 |
| 2010 | $7,422 +6.1% | $47,428 |
| 2009 | $6,996 +7% | $47,428 |
| 2008 | $6,539 -2.9% | $47,428 |
| 2007 | $6,736 | $47,428 |
Source: MRED as distributed by MLS GRID. This data may not be complete. We recommend contacting the local school district to confirm school assignments for this home.

A local agent can set up tours, give advice and negotiate with sellers.