$--
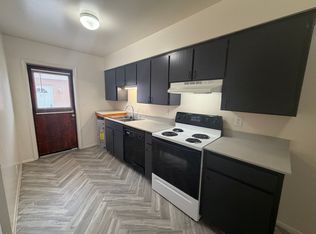
2 bd1 ba700 sqft
8439 E Coronado Rd APT 1, Scottsdale, AZ 85257
Off Market
Zillow last checked:
Listing updated:
Jennifer M Maldonado polly@pollymitchell.com,
Polly Mitchell Global Realty

Not available
Estimated sales range
Not available
Not available
| Date | Event | Price |
|---|---|---|
| 9/16/2026 | Listed for sale | $1,150,000+259.4%$596/sqft |
Source:  ARMLS #7080694 Report a problem | ||
| 5/2/2019 | Listing removed | $713 |
Source: Sundial Real Estate LC Report a problem | ||
| 4/23/2019 | Listed for rent | $713-12.4% |
Source: Sundial Real Estate LC Report a problem | ||
| 8/2/2018 | Listing removed | $814 |
Source: Sundial Real Estate LLC Report a problem | ||
| 7/5/2018 | Listed for rent | $814+23.1% |
Source: Sundial Real Estate LLC Report a problem | ||
| 2/28/2017 | Listing removed | $661 |
Source: Sundial Real Estate LLC Report a problem | ||
| 2/24/2017 | Price change | $661-3.8% |
Source: Sundial Real Estate LLC Report a problem | ||
| 2/6/2017 | Listed for rent | $687+1.8% |
Source: Sundial Real Estate LLC Report a problem | ||
| 3/23/2016 | Listing removed | $675 |
Source: Sundial Real Estate LLC Report a problem | ||
| 2/29/2016 | Listed for rent | $675 |
Source: Sundial Real Estate LLC Report a problem | ||
| 8/7/2015 | Listing removed | $675 |
Source: Sundial Real Estate LLC Report a problem | ||
| 6/18/2015 | Listed for rent | $675+8% |
Source: Sundial Real Estate LLC Report a problem | ||
| 1/7/2014 | Listing removed | $625 |
Source: Sundial Real Estate LLC Report a problem | ||
| 12/21/2013 | Listed for rent | $625 |
Source: Sundial Real Estate LLC Report a problem | ||
| 10/15/2007 | Sold | $320,000+23.1%$166/sqft |
Source: ARMLS #2584444 Report a problem | ||
| 1/28/2005 | Sold | $260,000+40.5%$135/sqft |
Source: ARMLS #2229967 Report a problem | ||
| 12/18/2003 | Sold | $185,000$96/sqft |
Source: Public Record Report a problem | ||
| Year | Property taxes | Tax assessment |
|---|---|---|
| 2025 | $975 +4.4% | $55,720 -2.8% |
| 2024 | $934 +11.6% | $57,310 +354.5% |
| 2023 | $837 +3.2% | $12,609 -58.1% |
| 2022 | $811 -6.1% | $30,120 +18.3% |
| 2021 | $864 +2.7% | $25,450 +4.7% |
| 2020 | $841 +3.3% | $24,300 +4.7% |
| 2019 | $815 | $23,210 +12.3% |
| 2018 | $815 +6.6% | $20,670 -0.5% |
| 2017 | $764 +6.7% | $20,780 +33.6% |
| 2016 | $716 -7.2% | $15,550 +22.8% |
| 2015 | $772 | $12,660 +12.9% |
| 2014 | -- | $11,210 +57.9% |
| 2013 | -- | $7,100 -10.9% |
| 2012 | -- | $7,970 -8.5% |
| 2011 | -- | $8,710 -32.8% |
| 2010 | -- | $12,960 -45.8% |
| 2009 | -- | $23,930 -1.7% |
| 2008 | -- | $24,350 +20.2% |
| 2007 | -- | $20,250 +51.1% |
| 2006 | -- | $13,400 |
| 2005 | -- | $13,400 +16.5% |
| 2004 | -- | $11,500 |
| 2003 | -- | $11,500 +19.2% |
| 2002 | -- | $9,650 |


A local agent can set up tours, give advice and negotiate with sellers.